Swiss Income Tax for High Earners
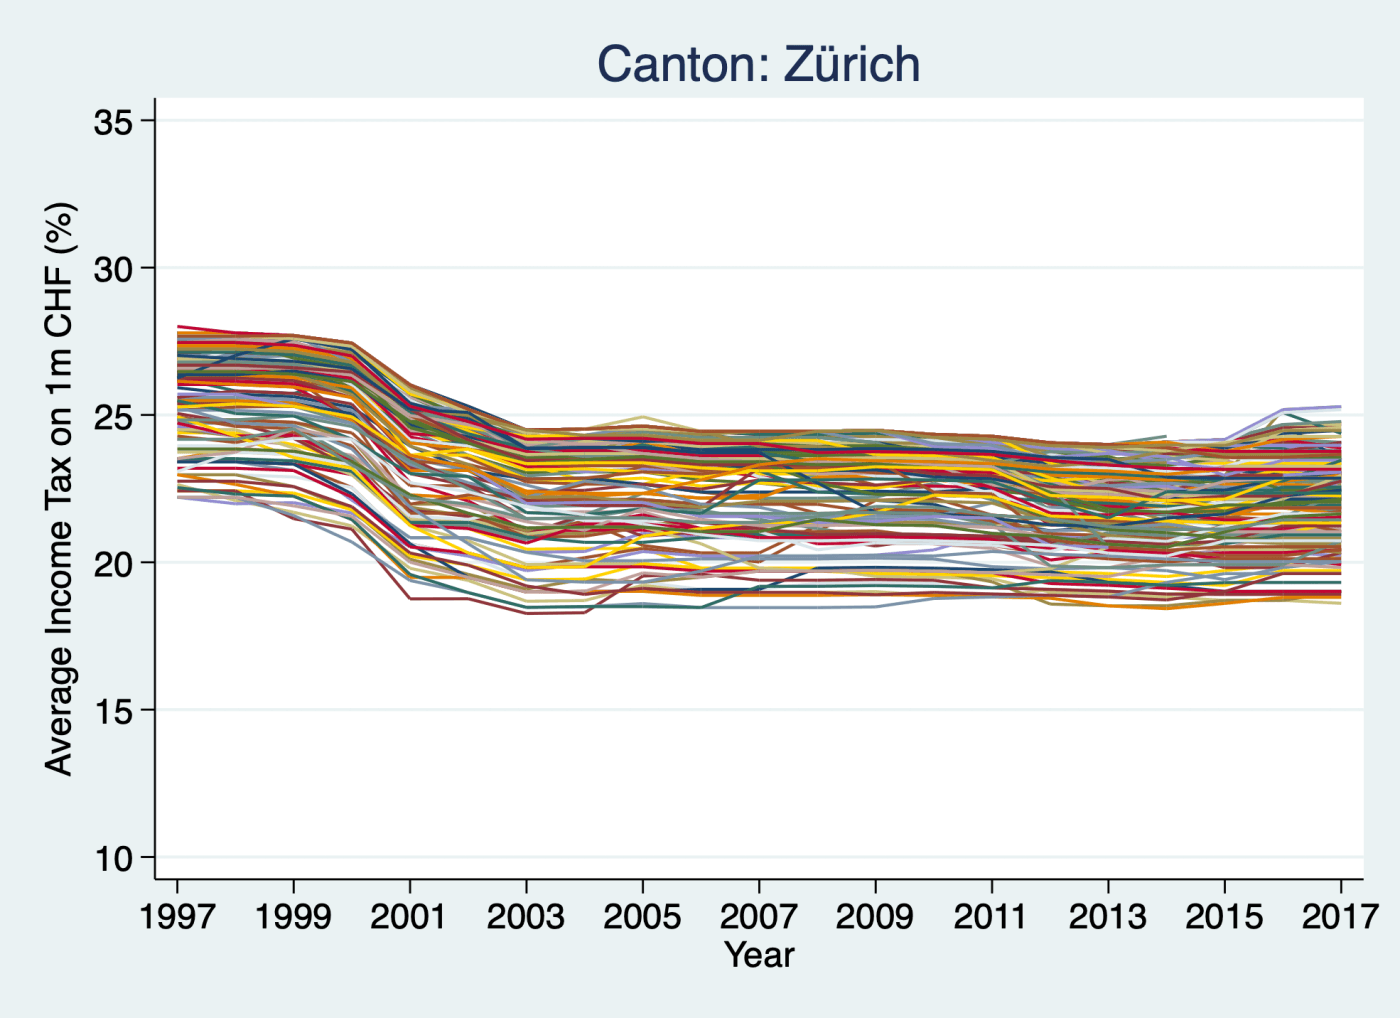
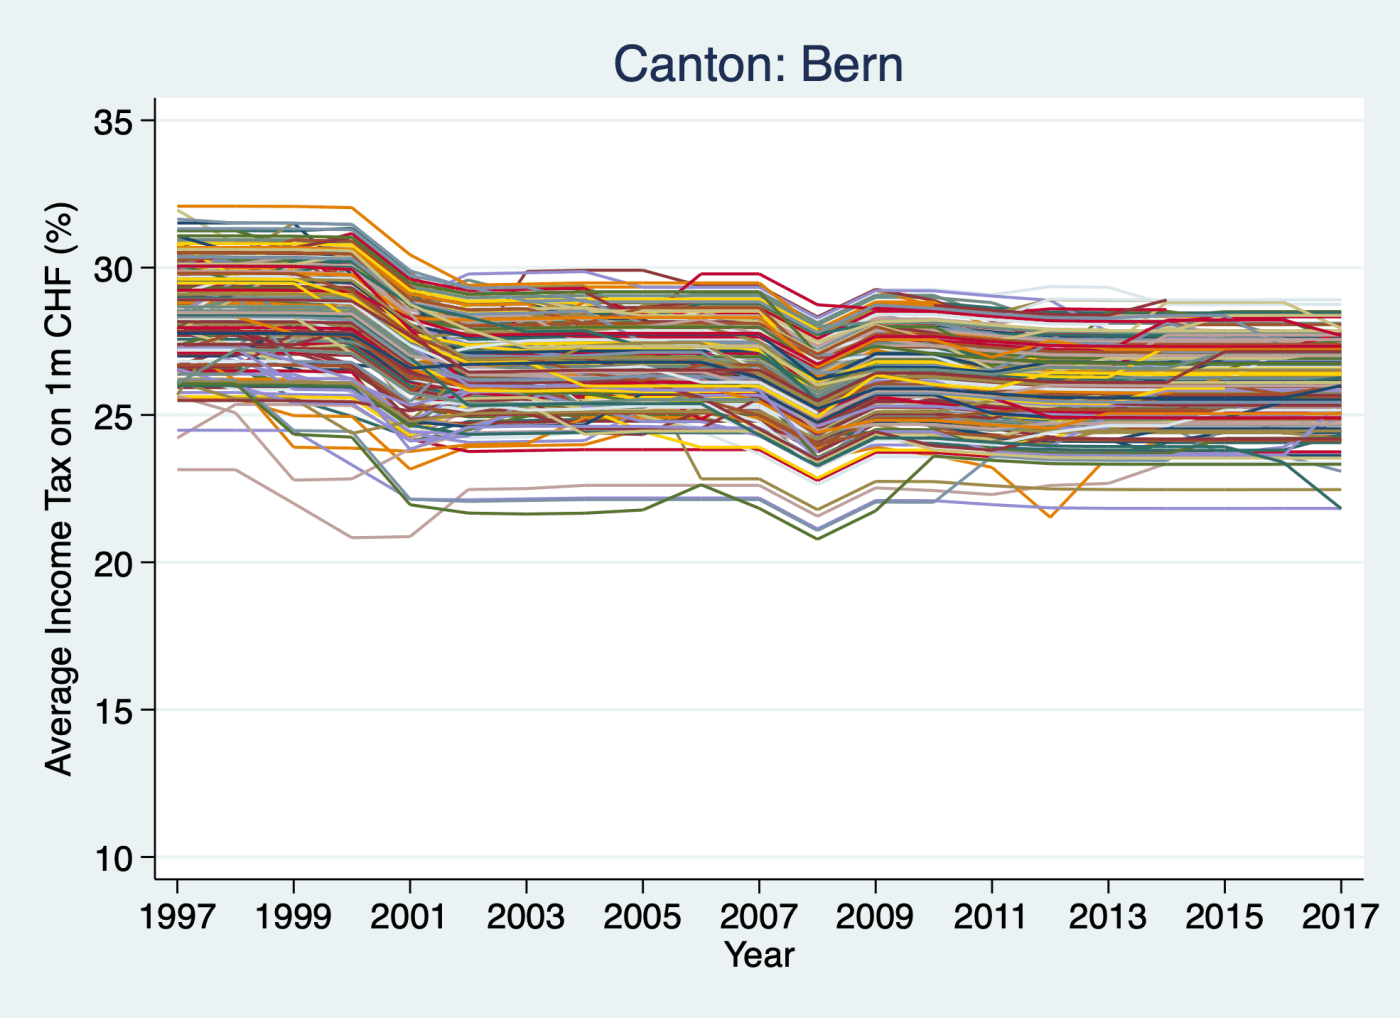
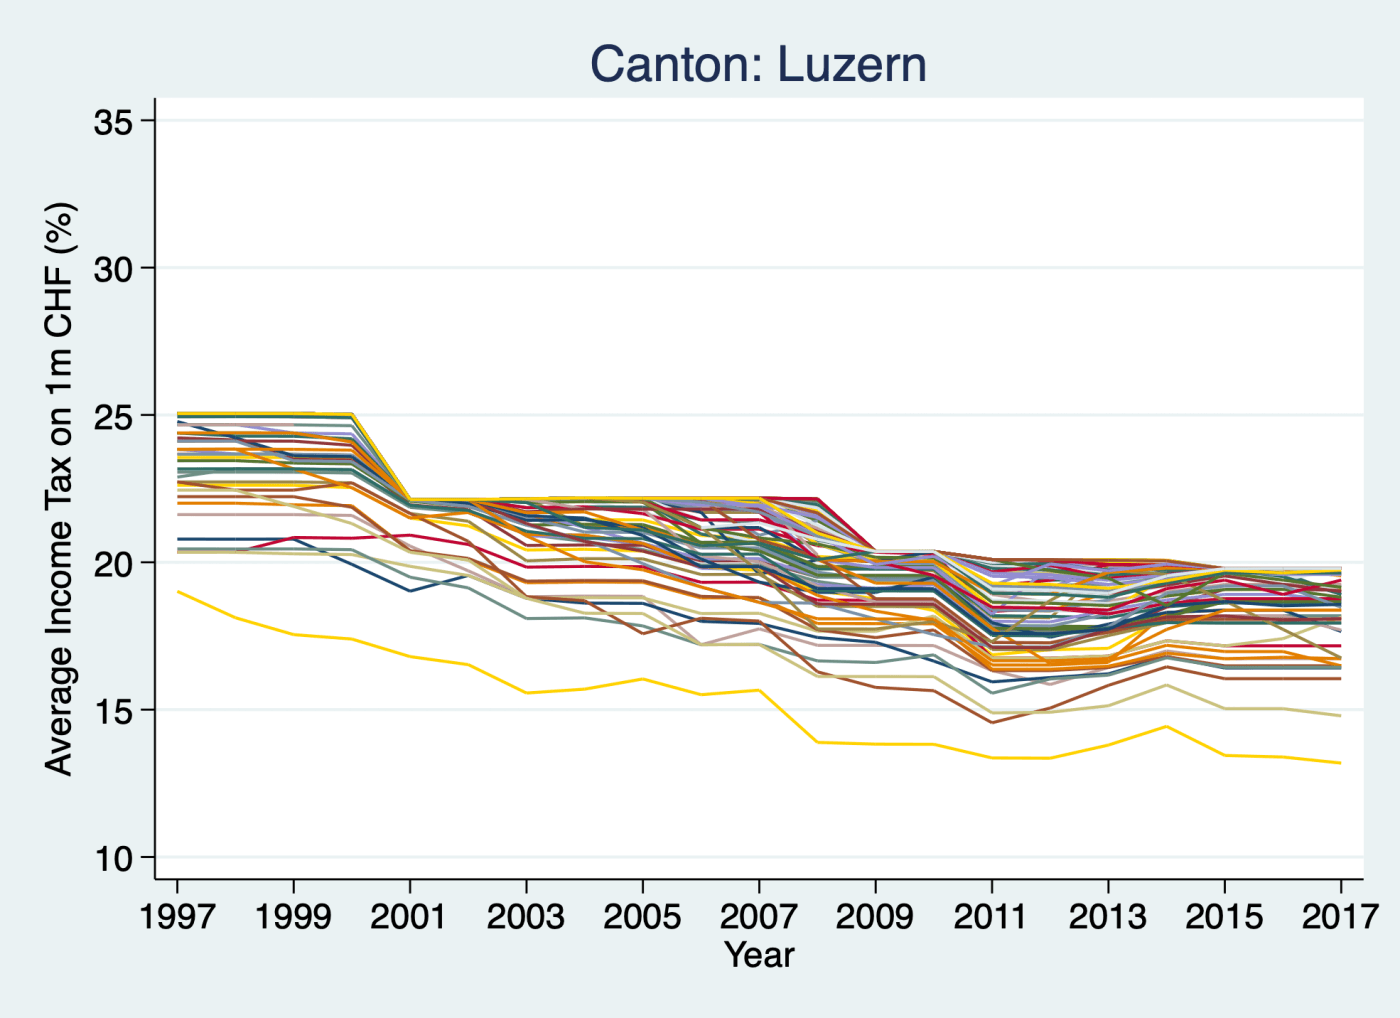
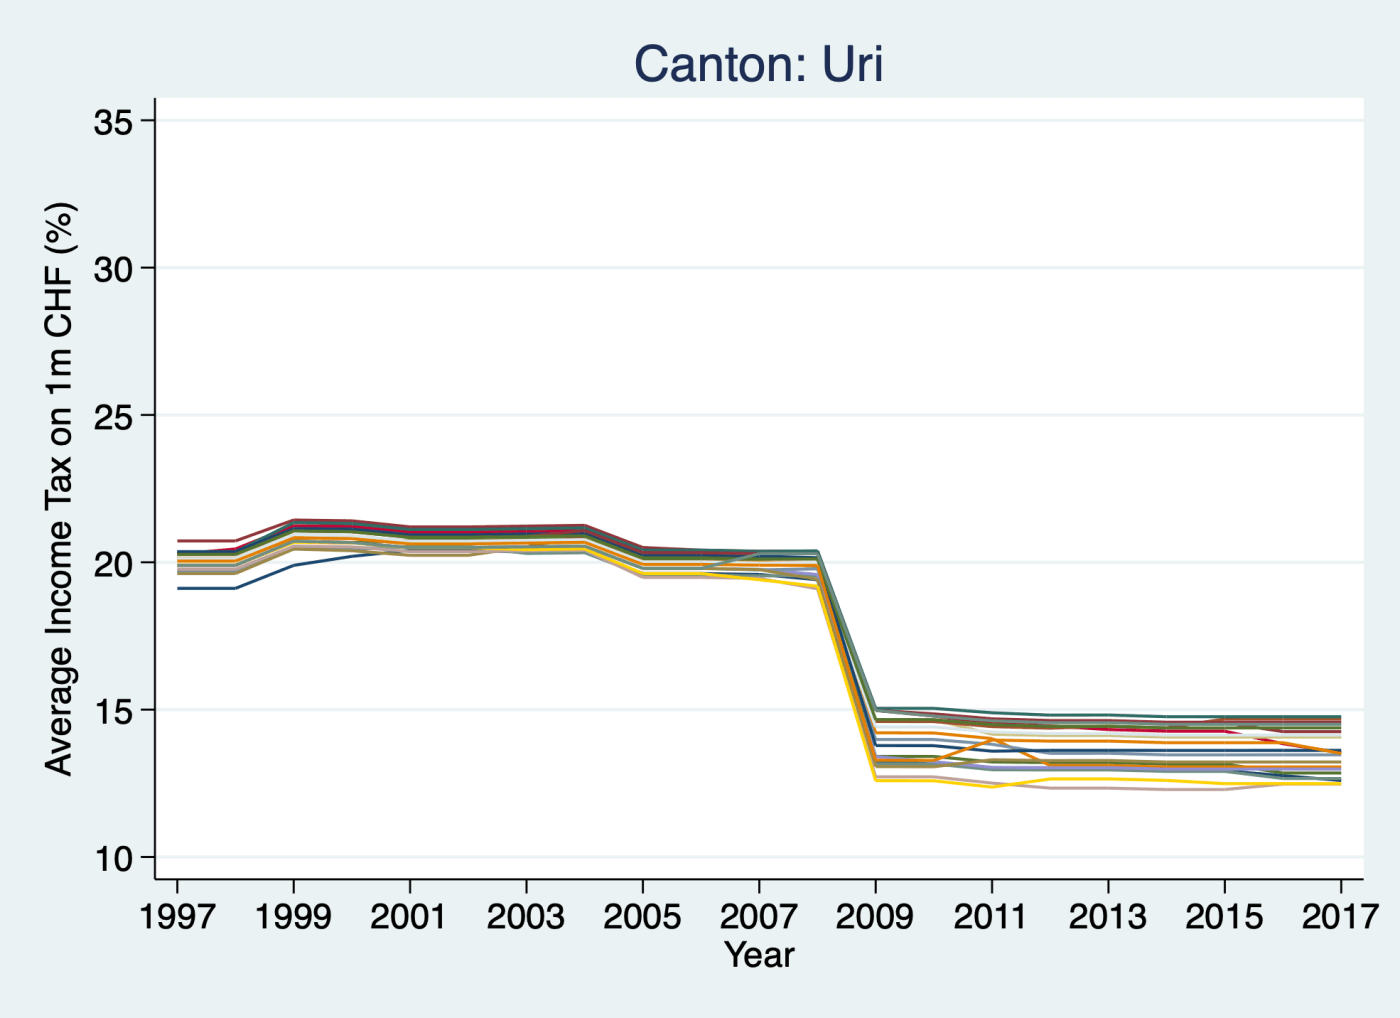
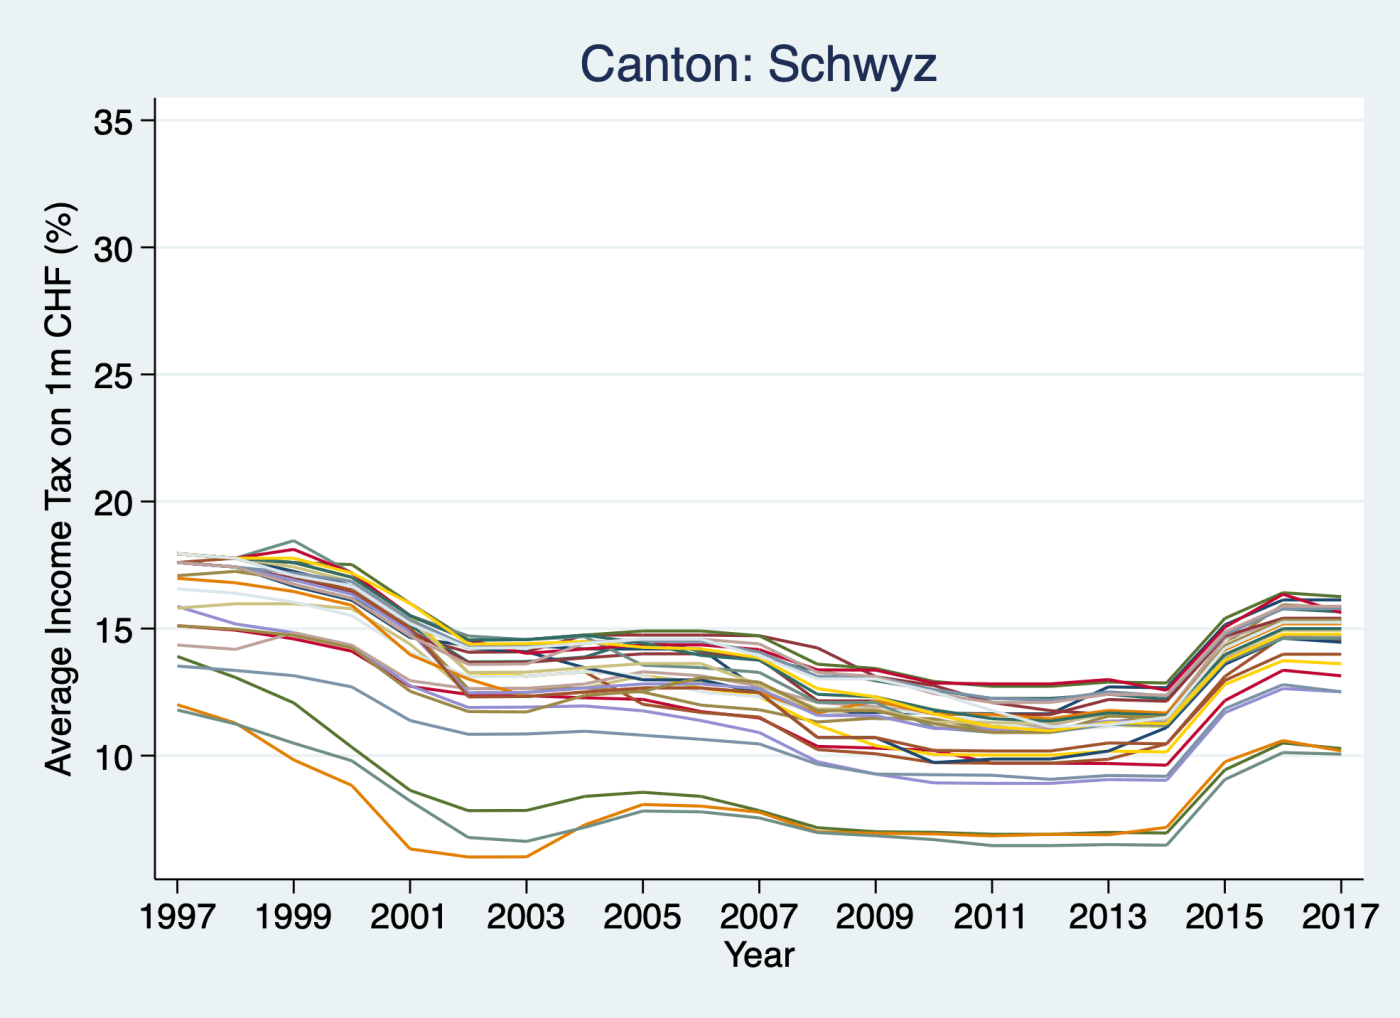
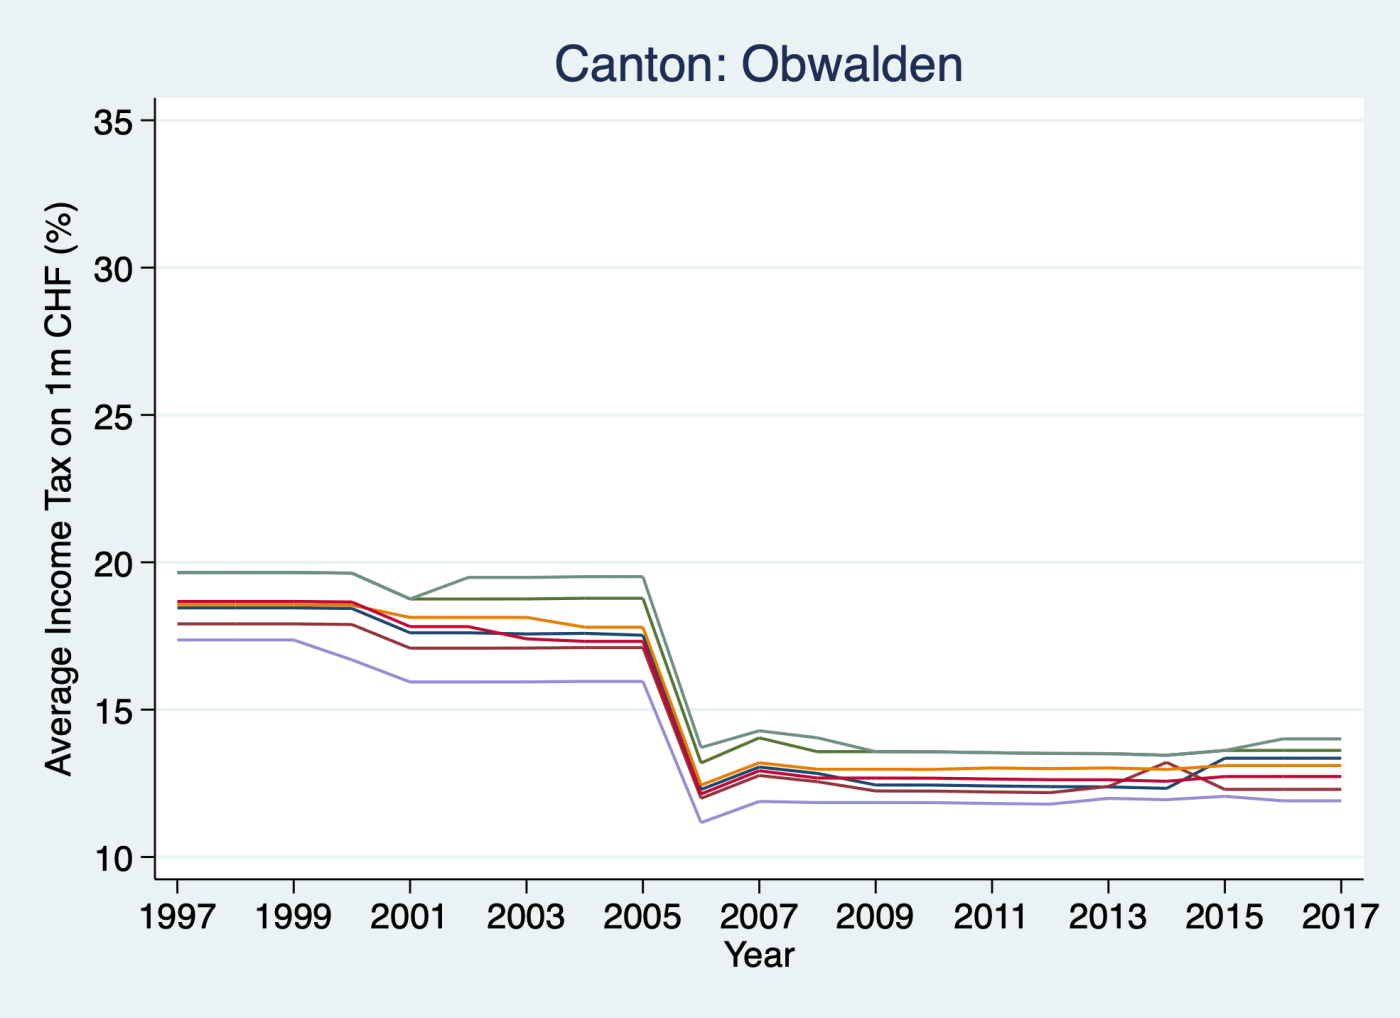
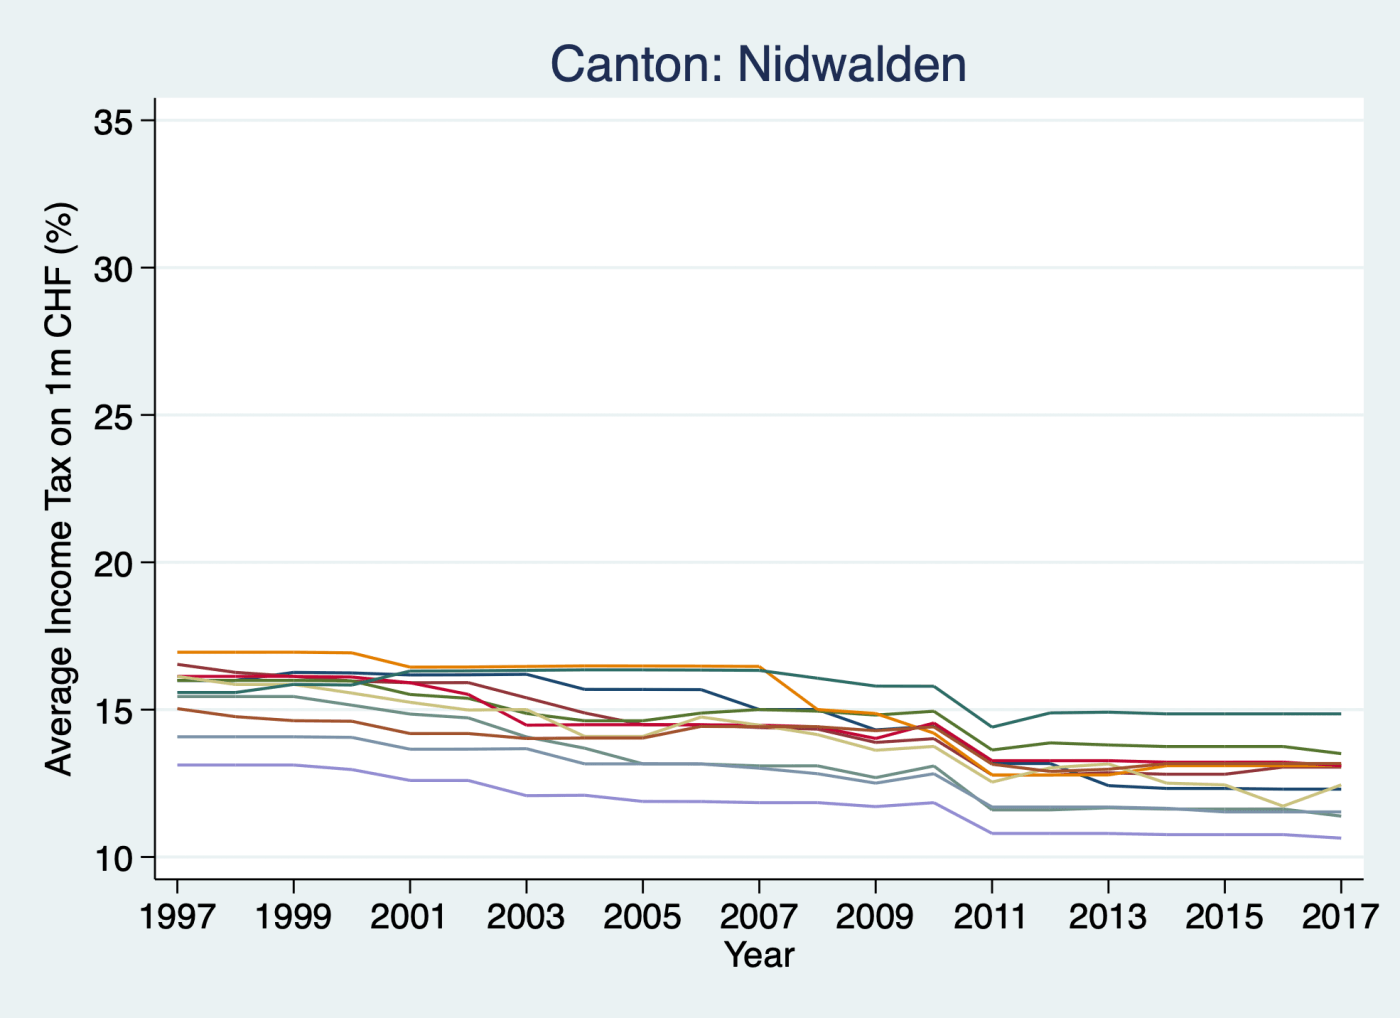
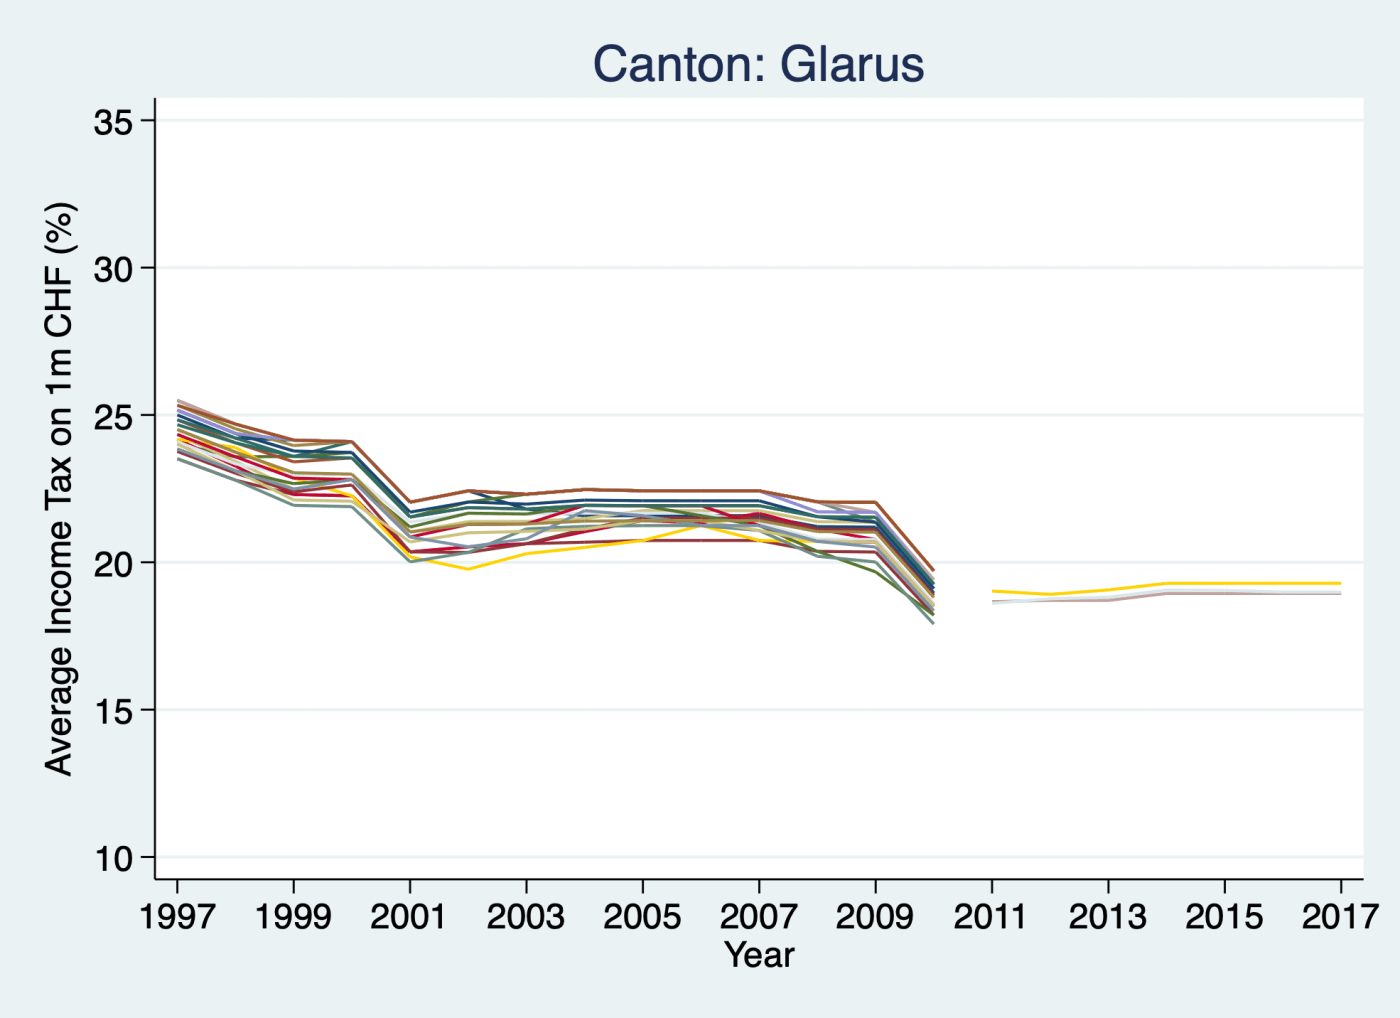
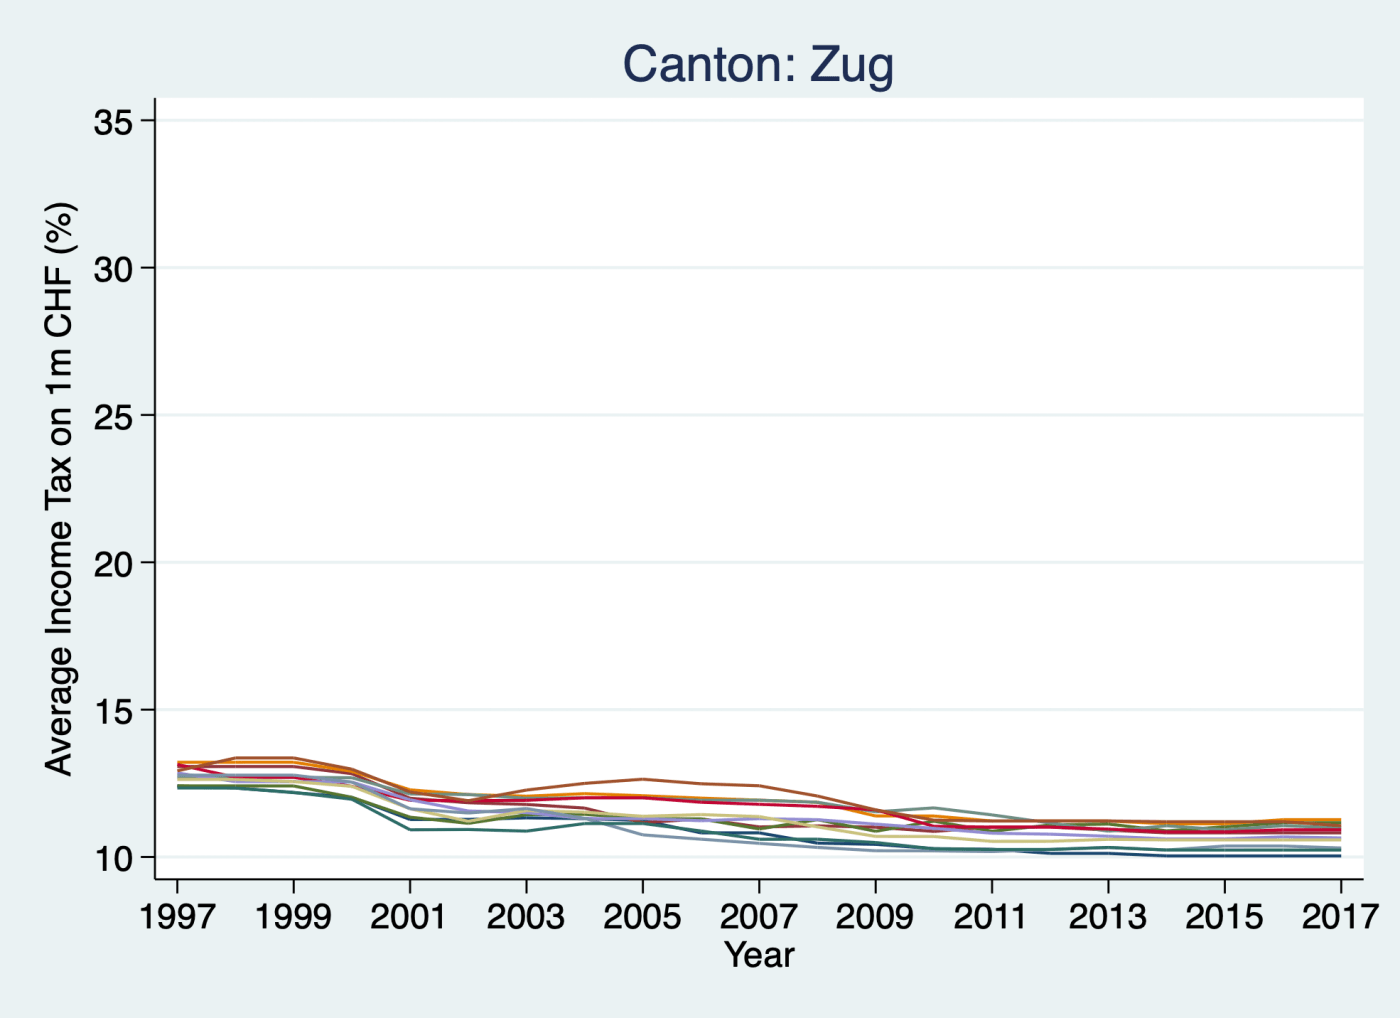
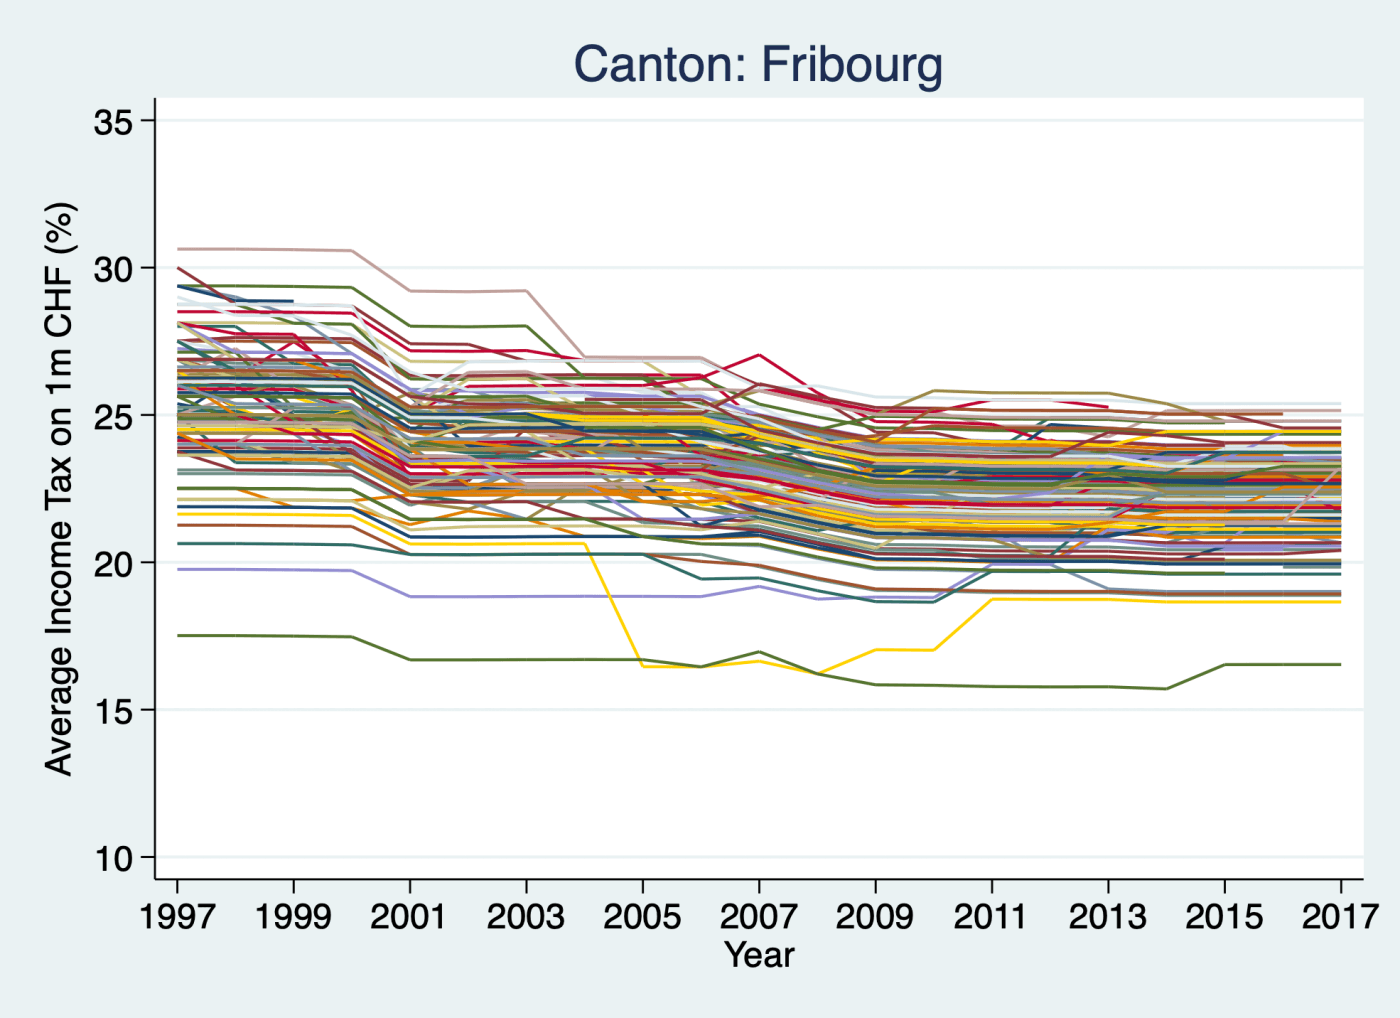
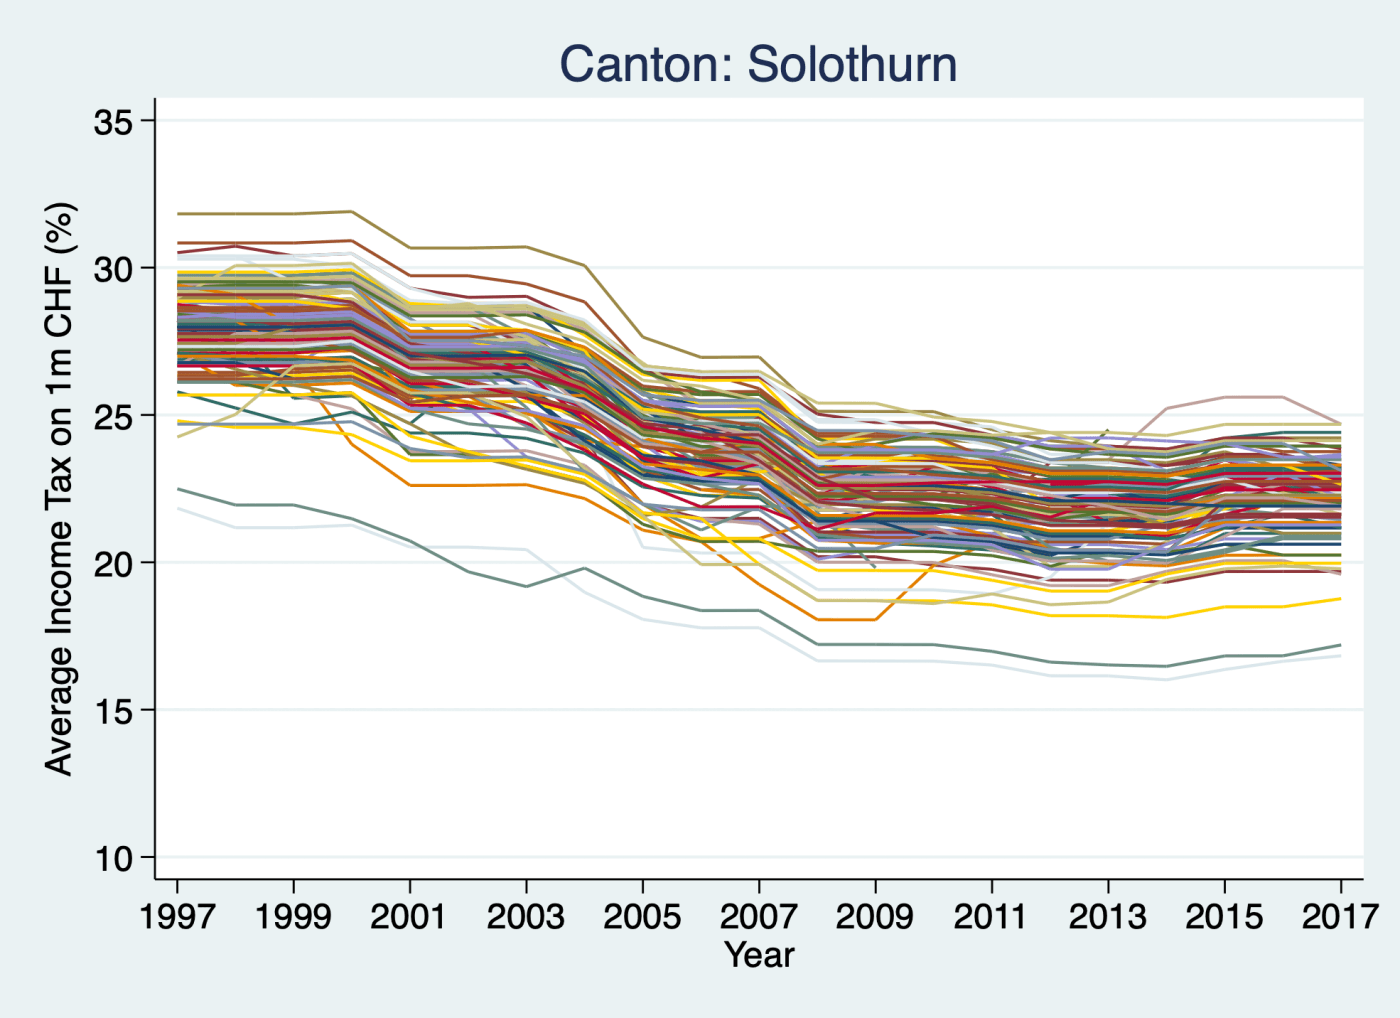
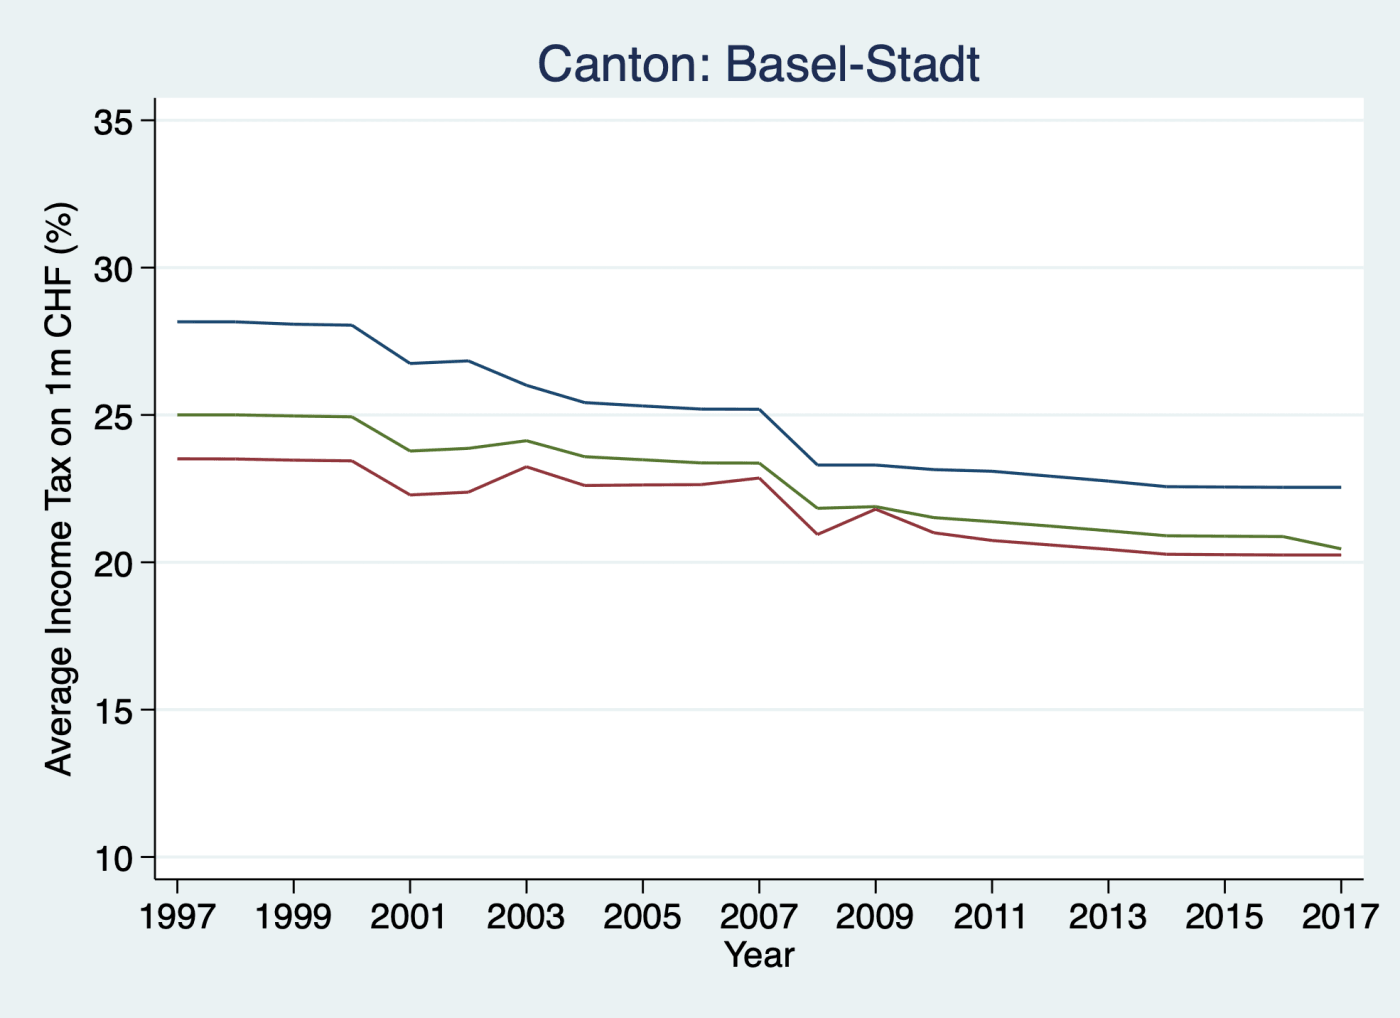
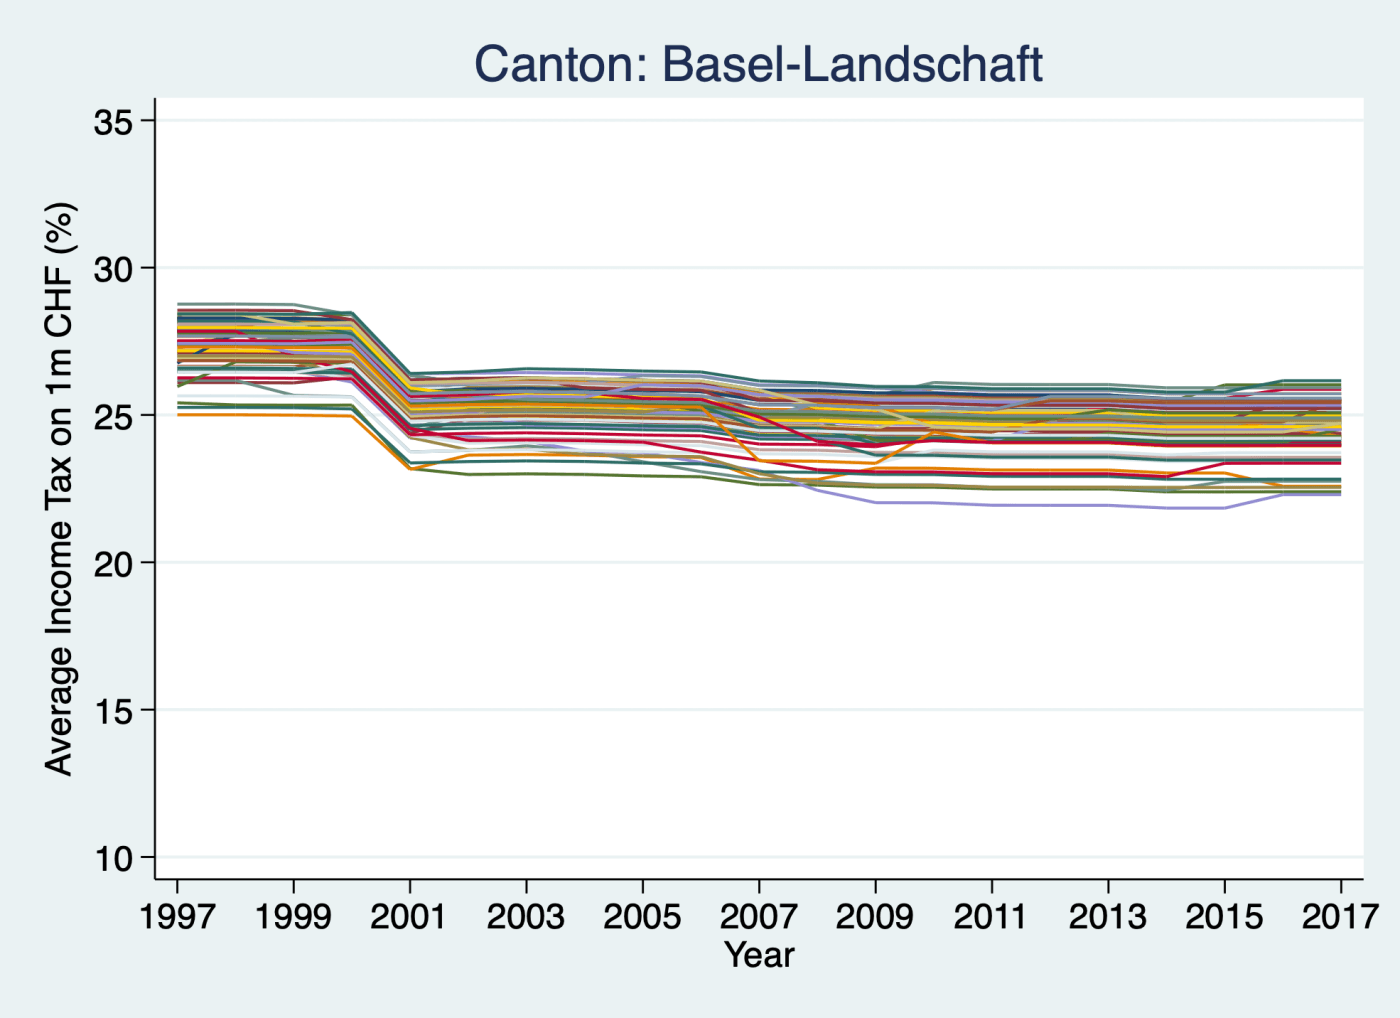
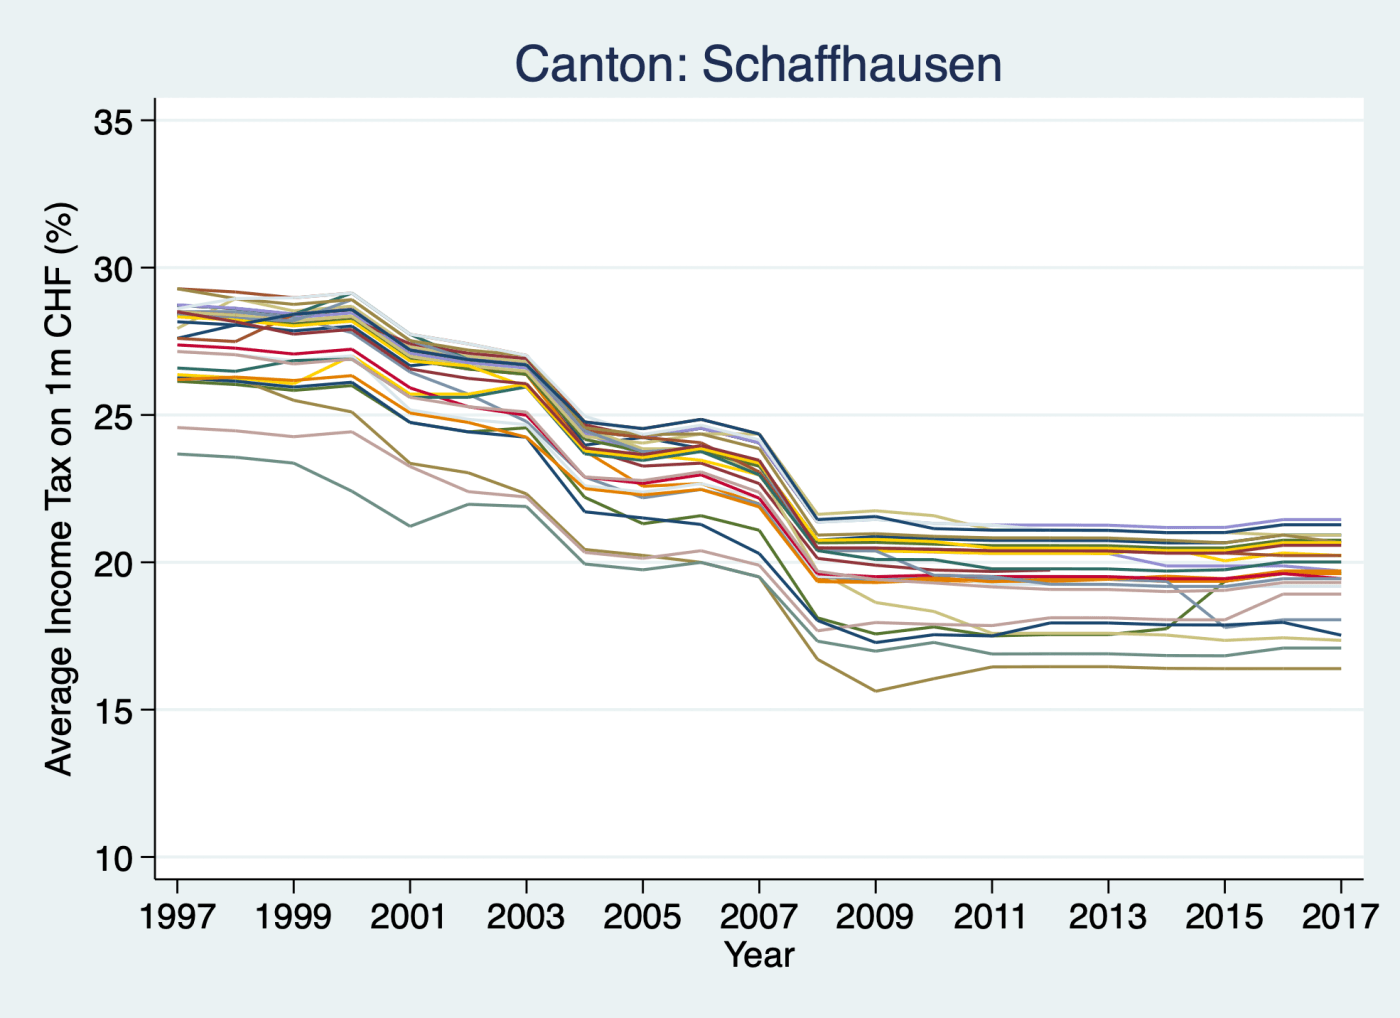
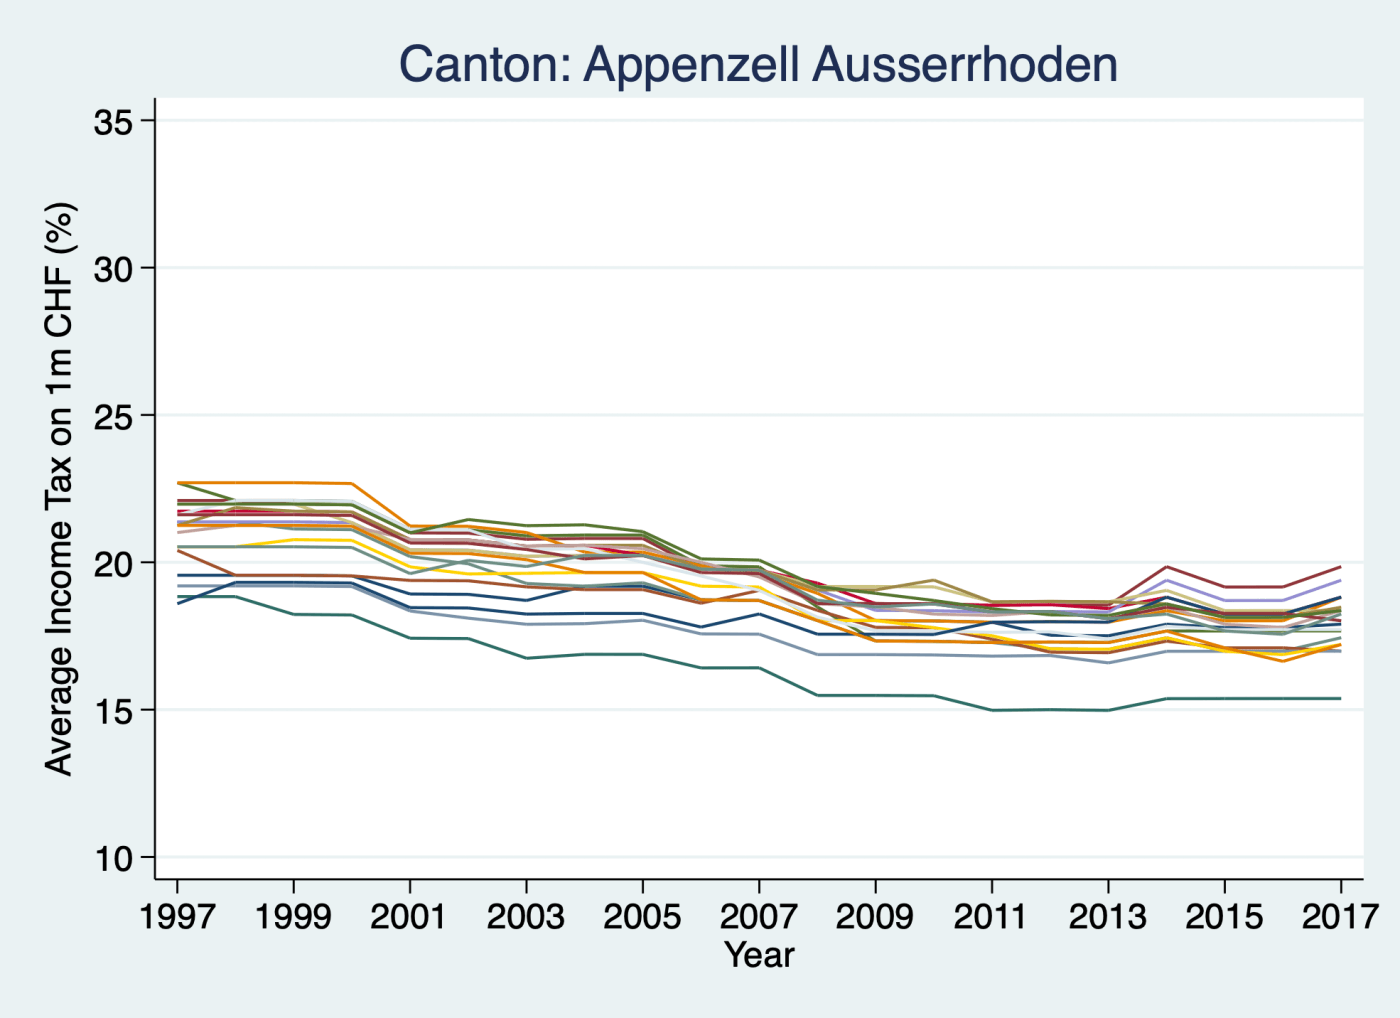
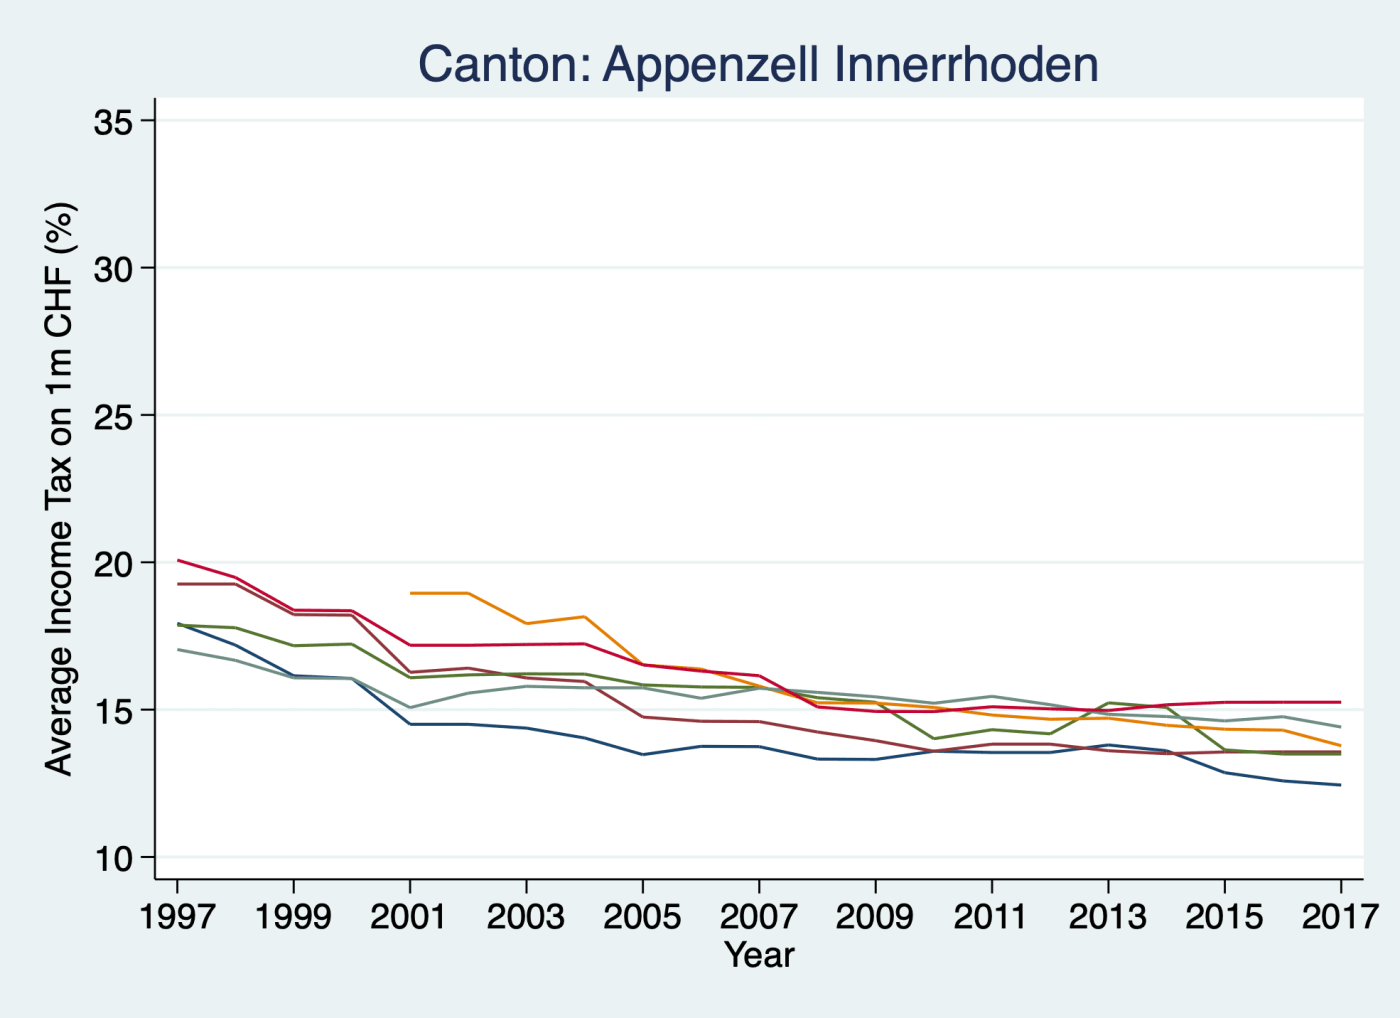
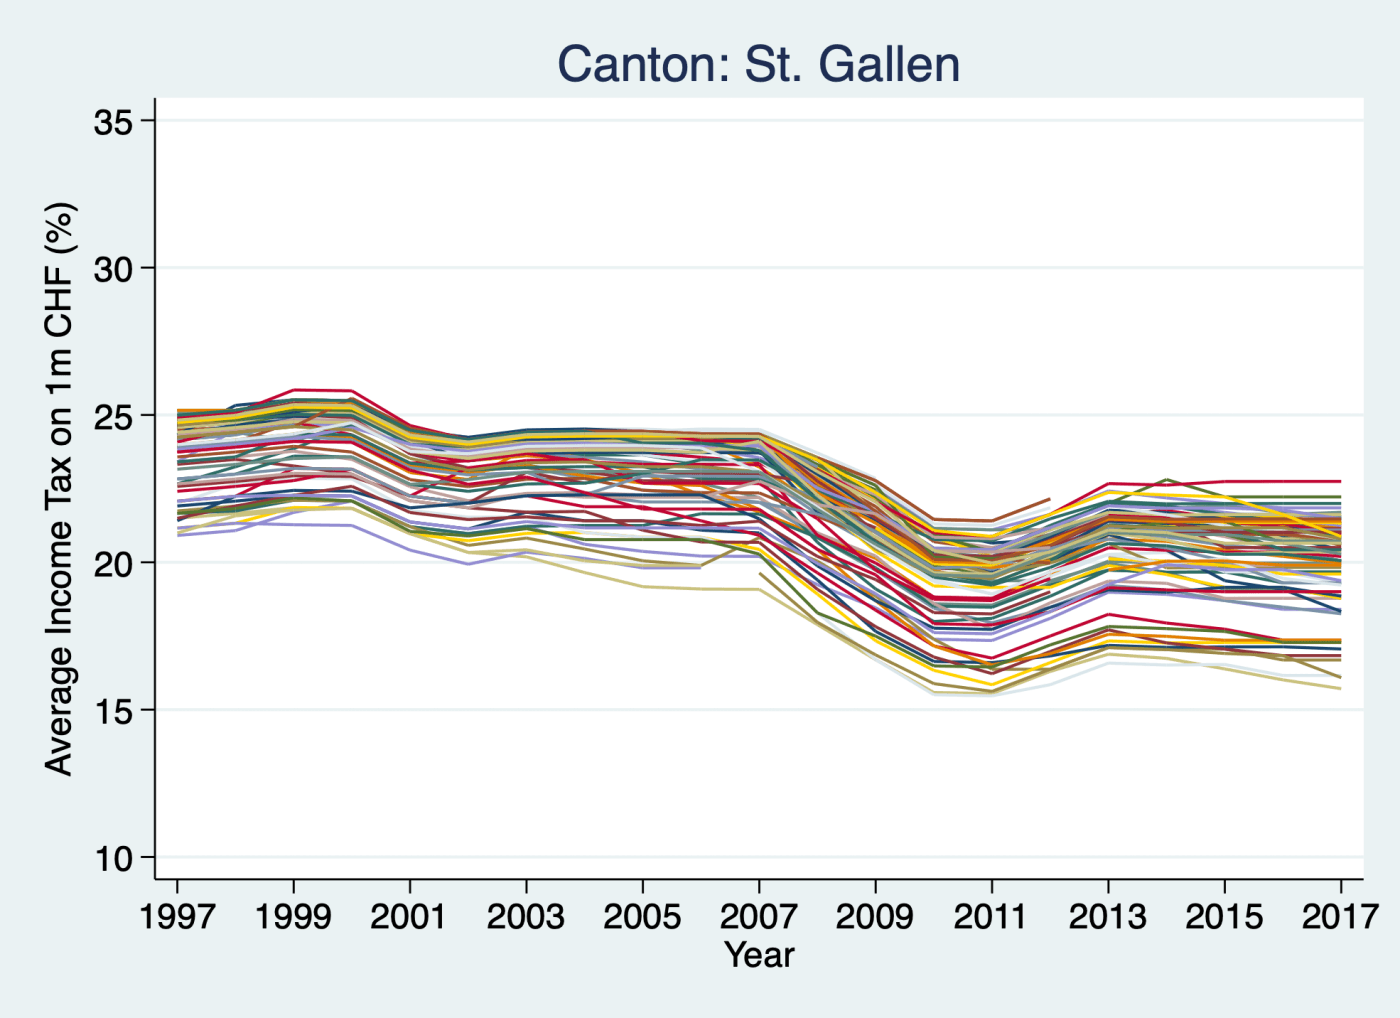
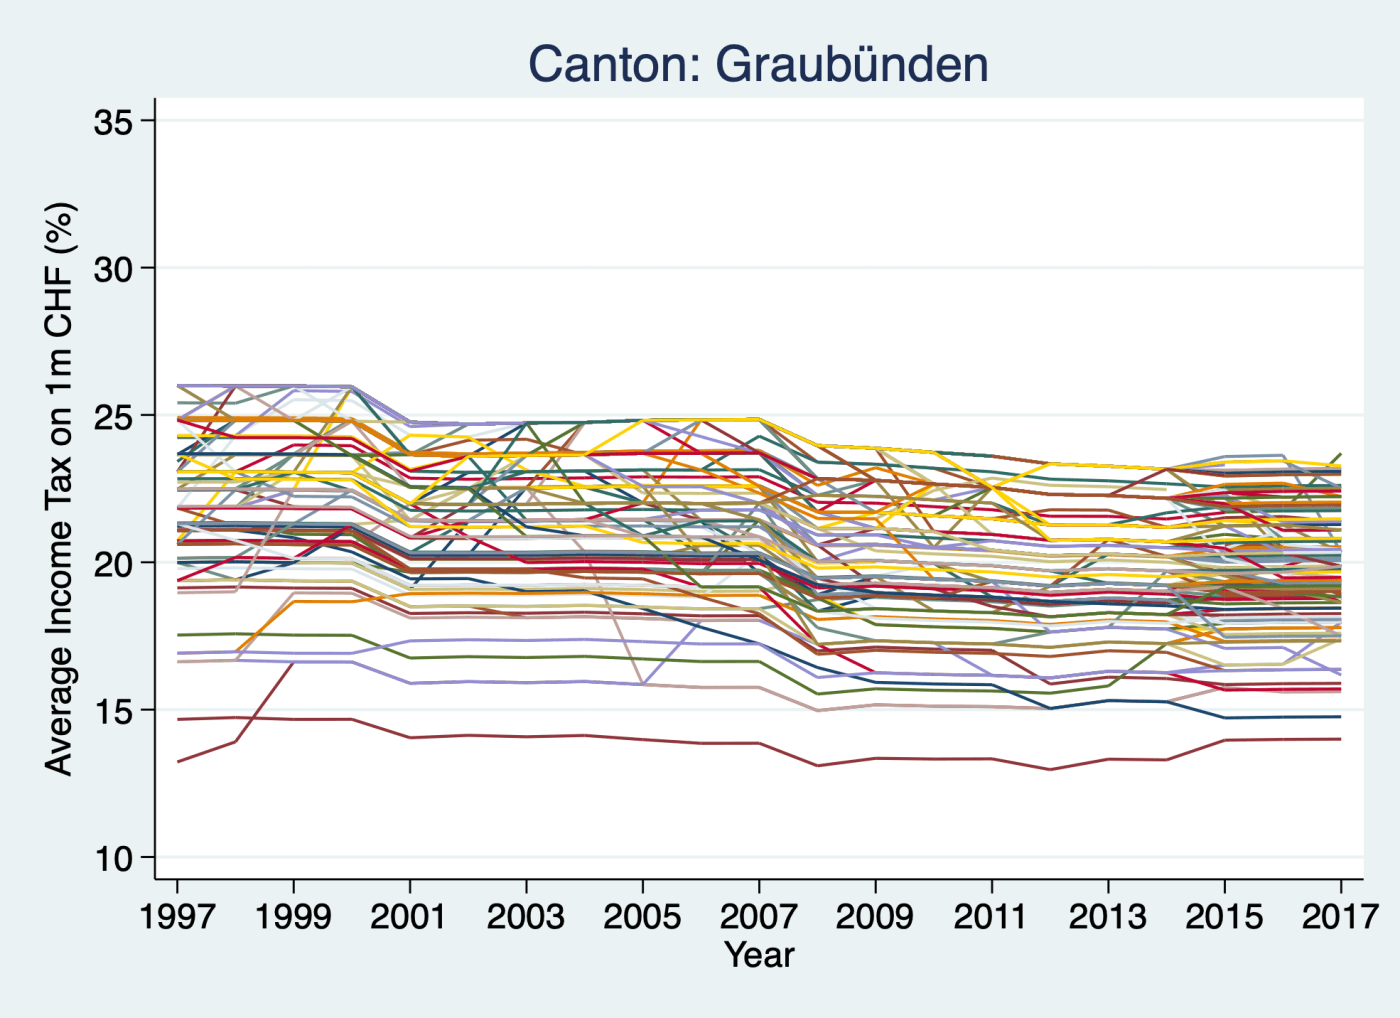
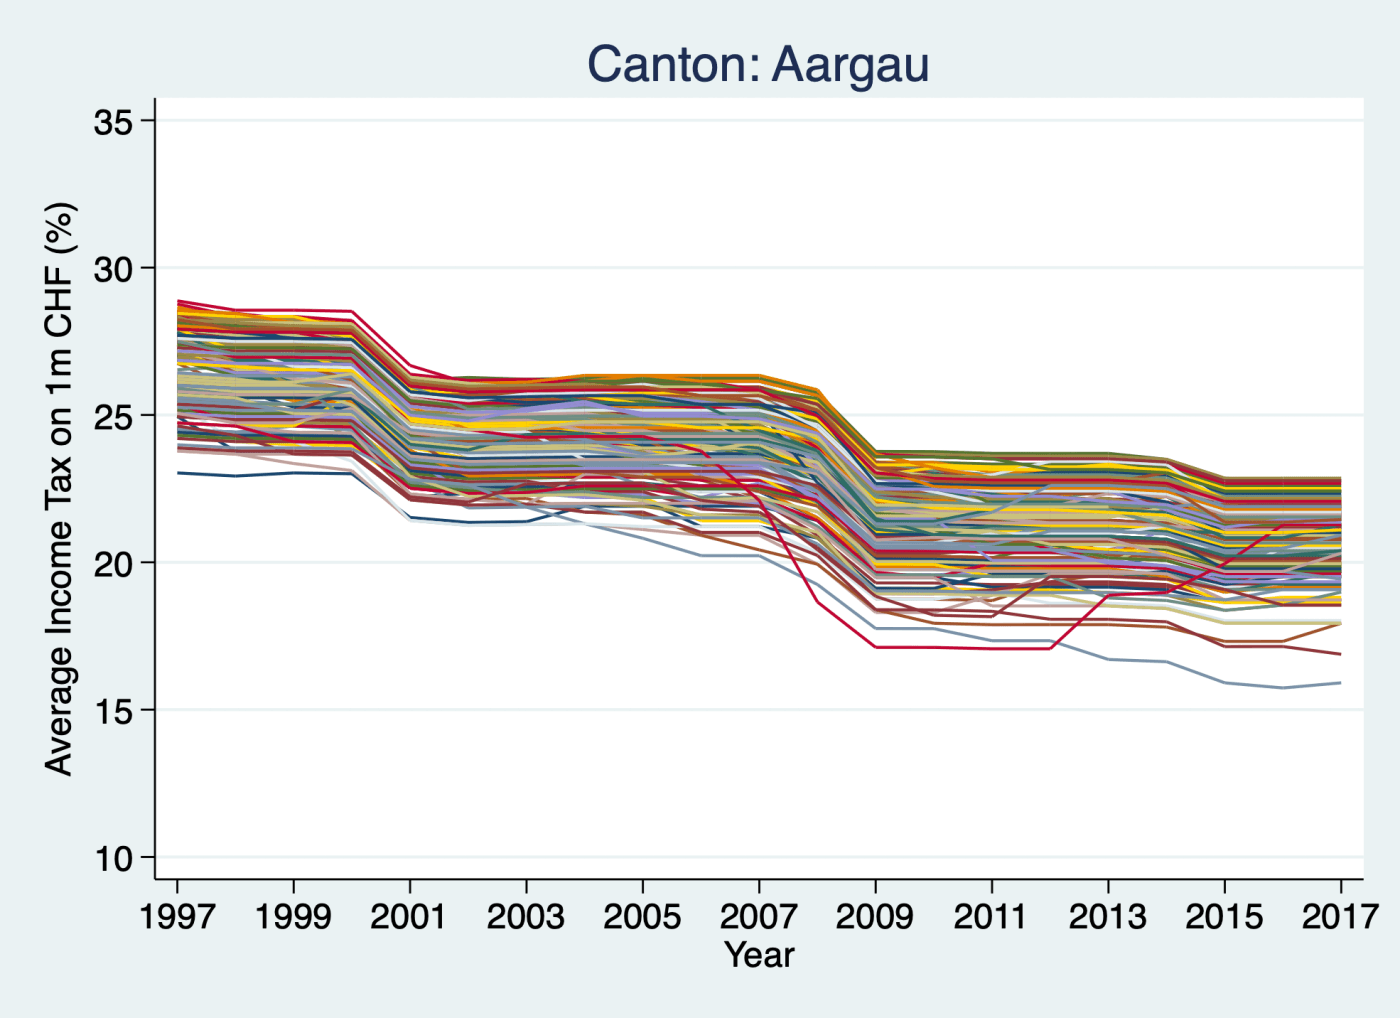
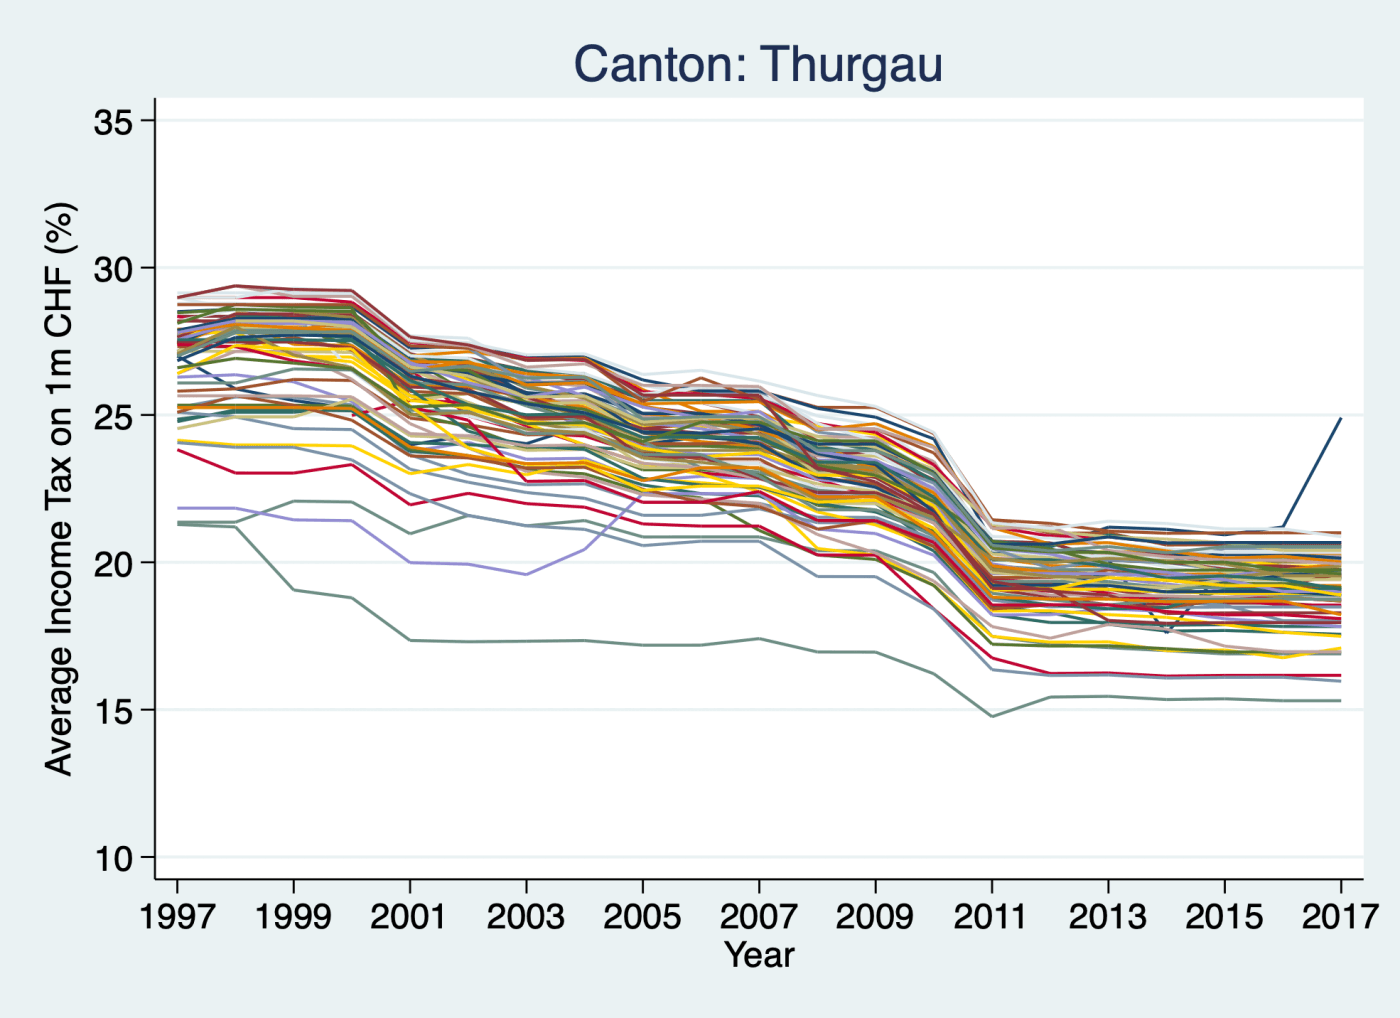
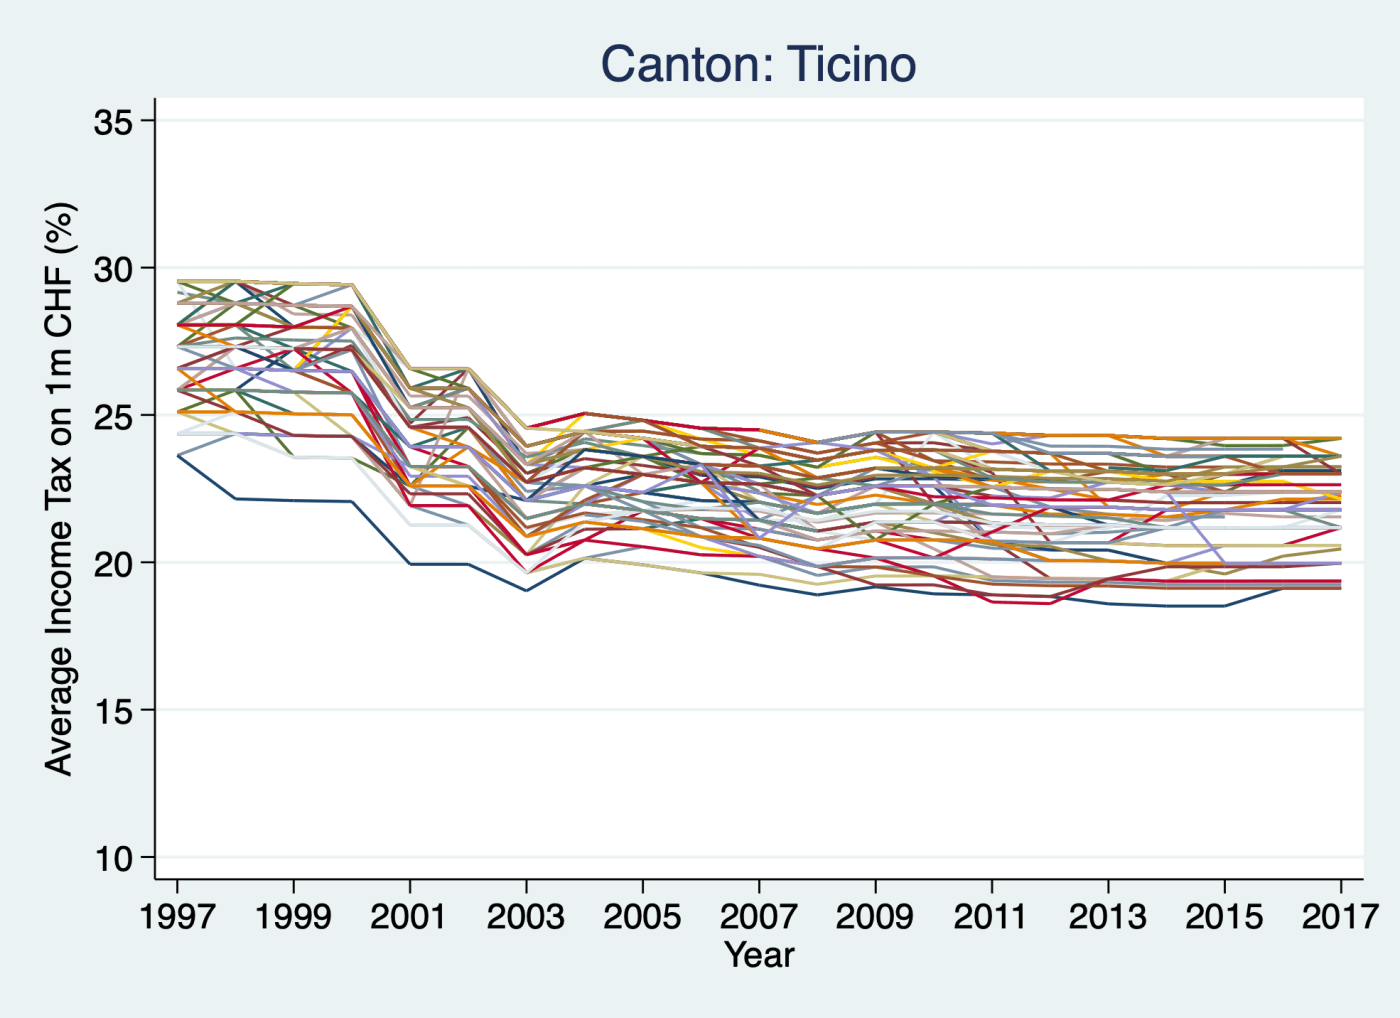
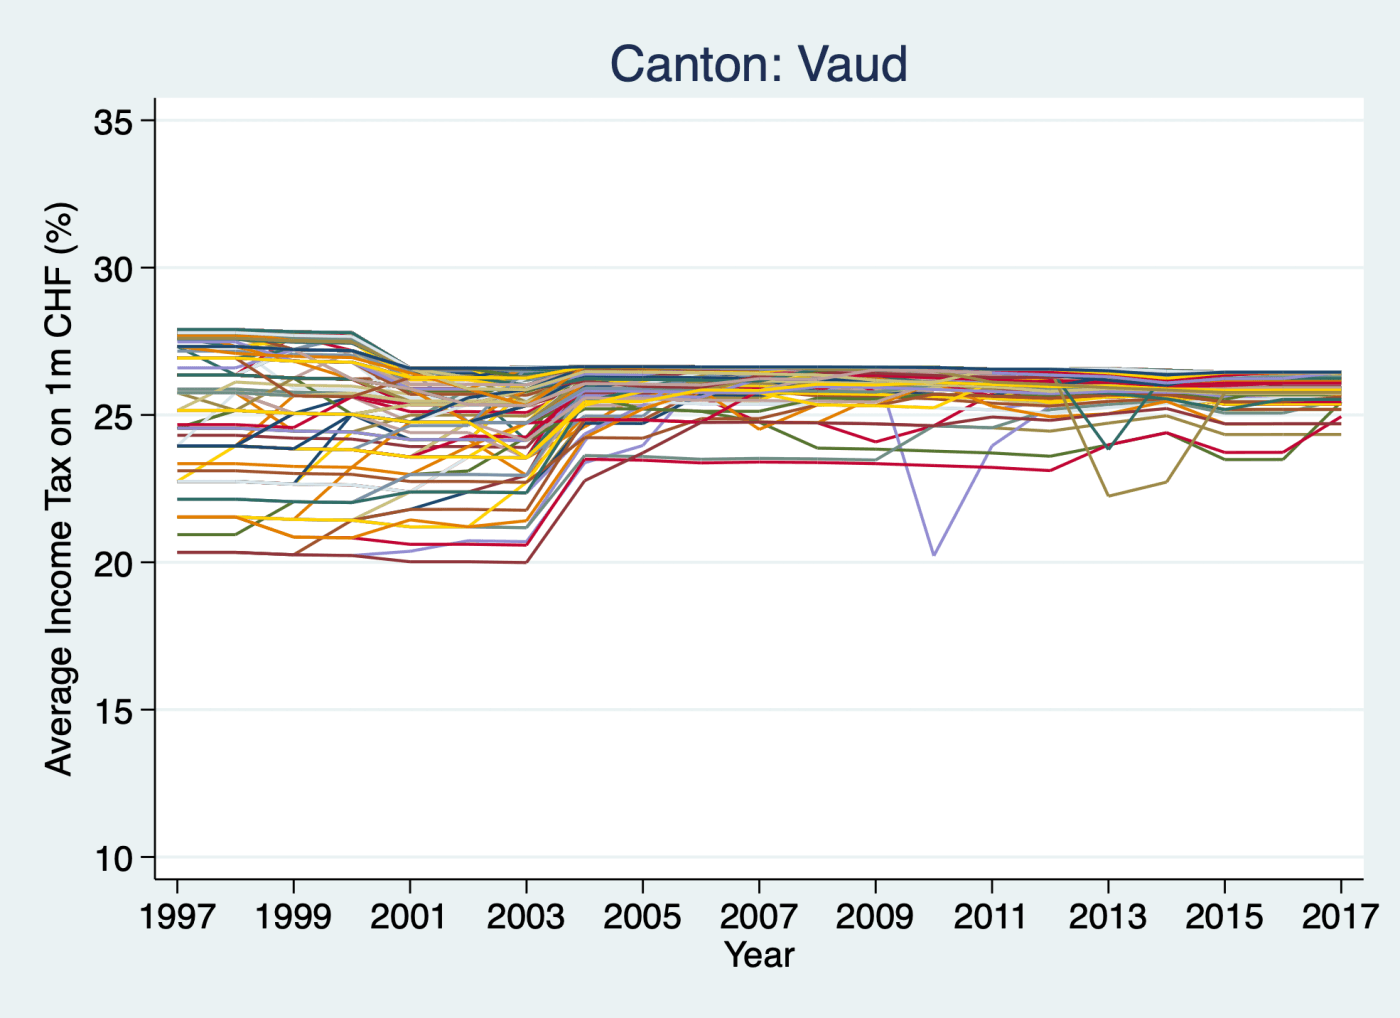
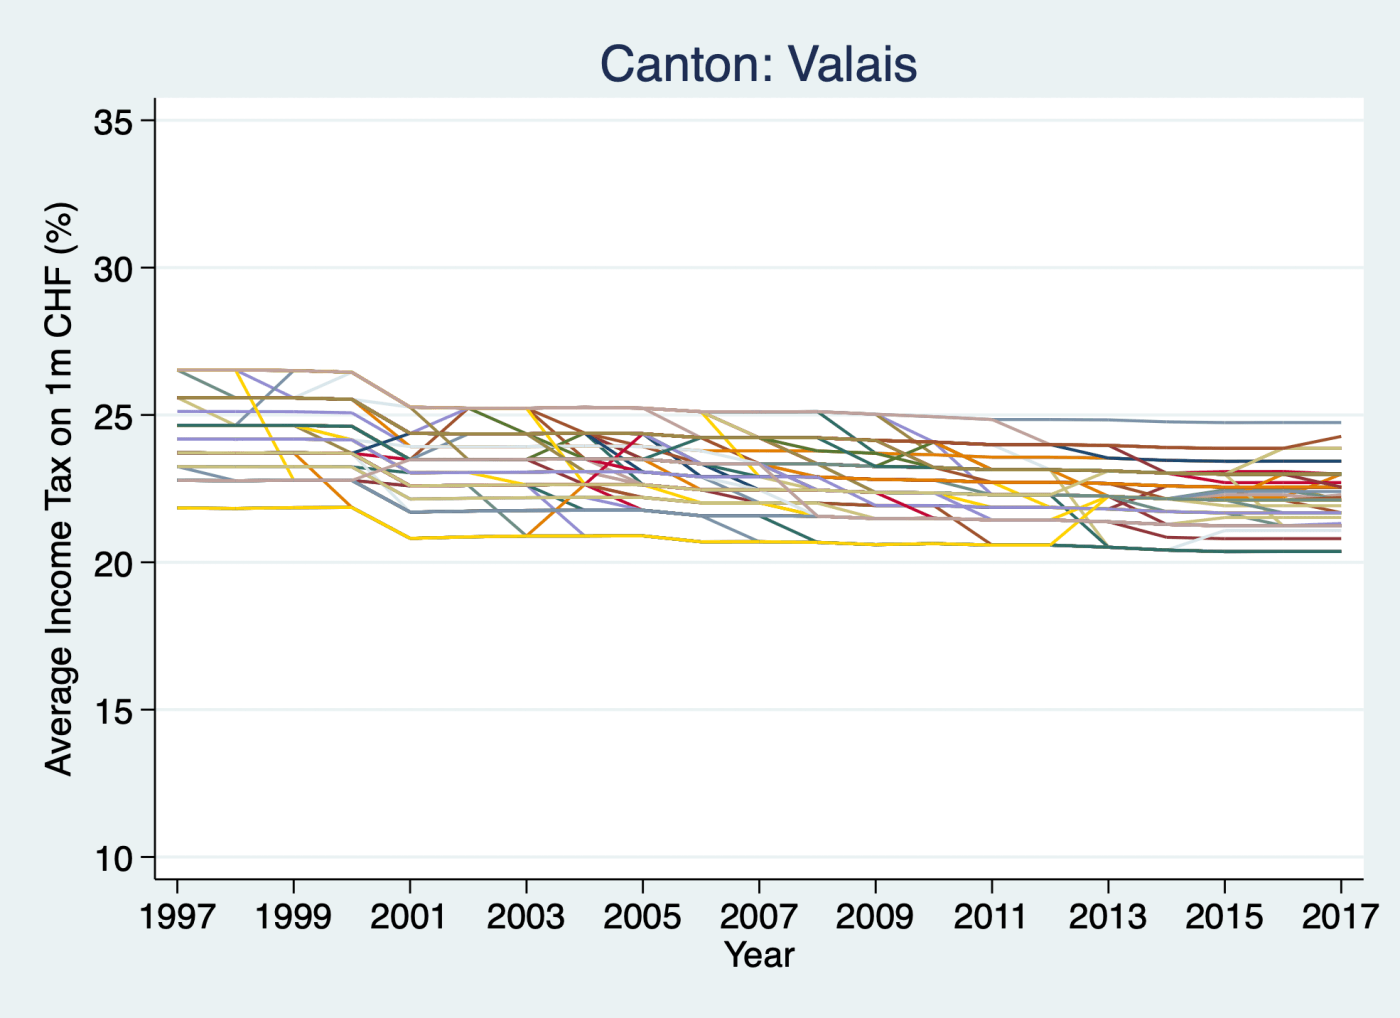
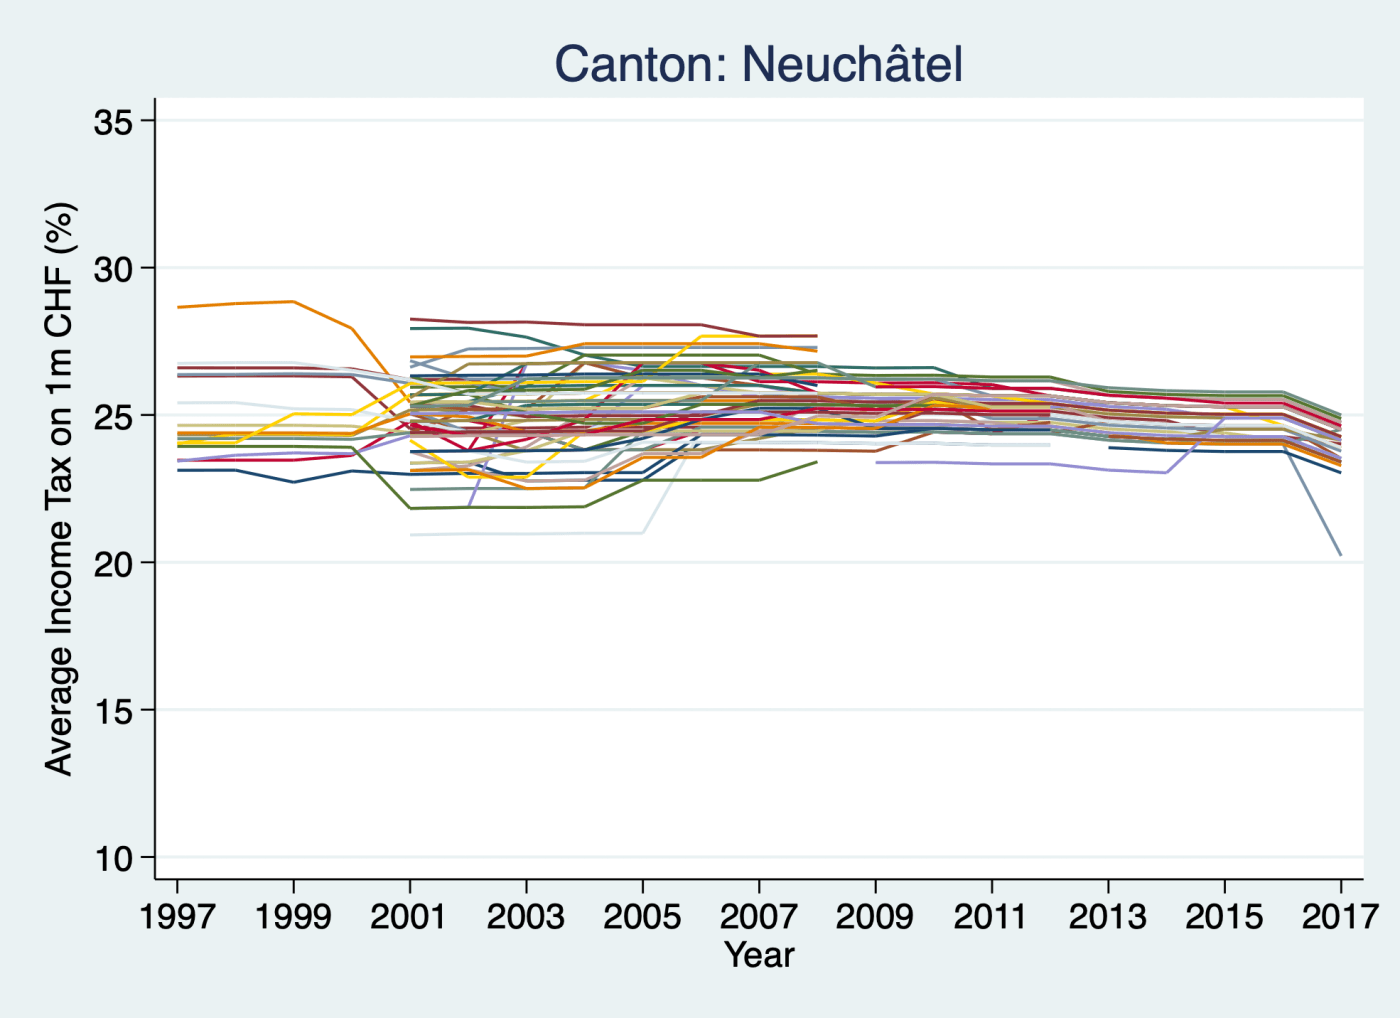
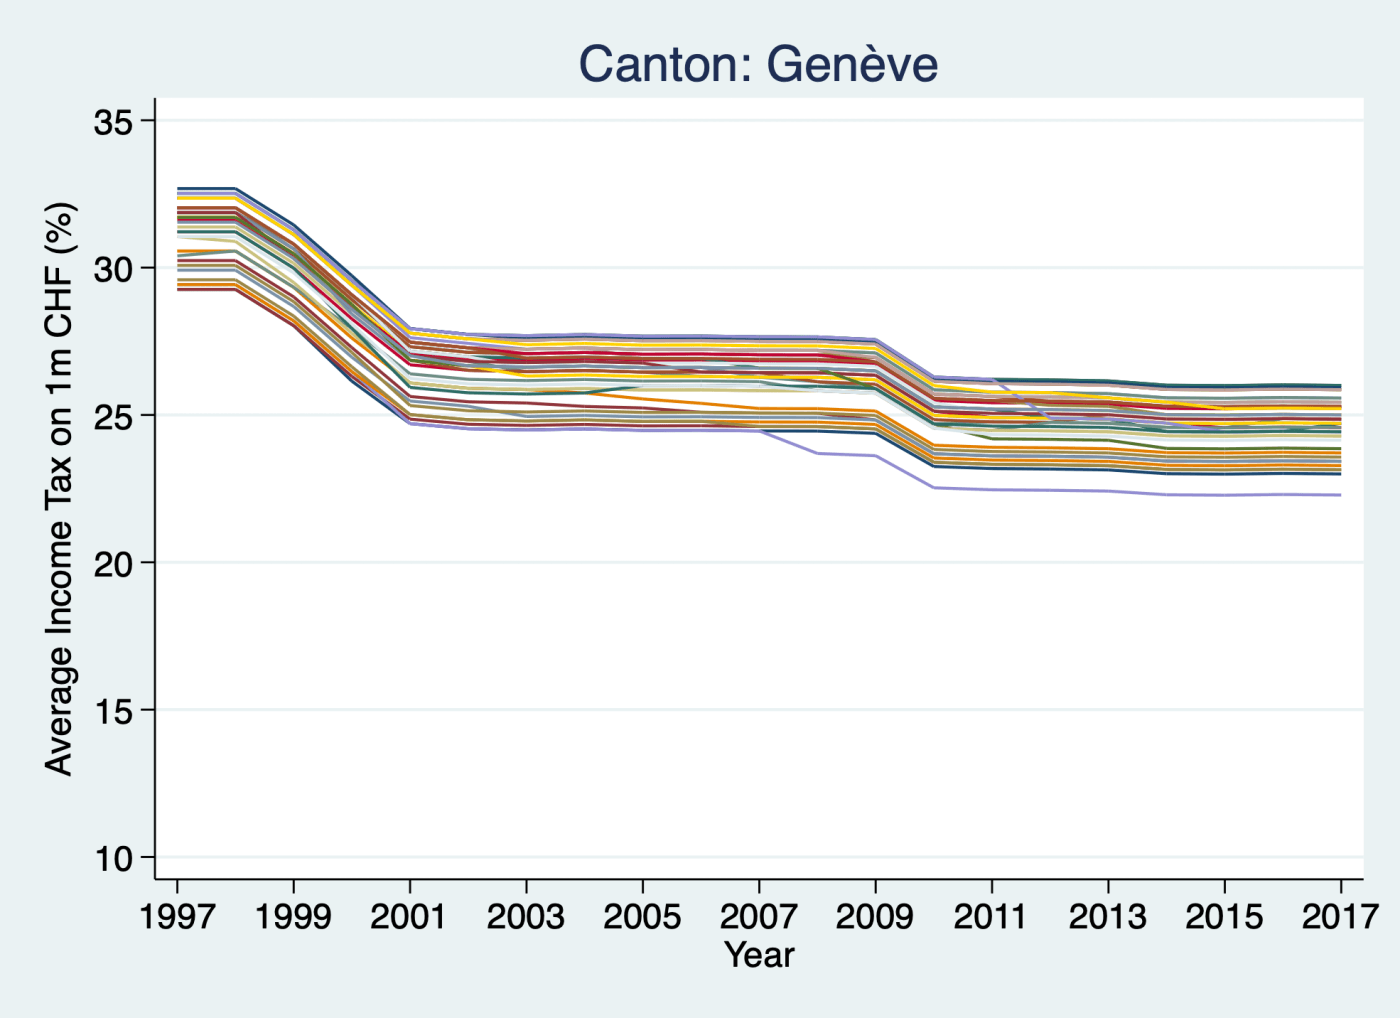
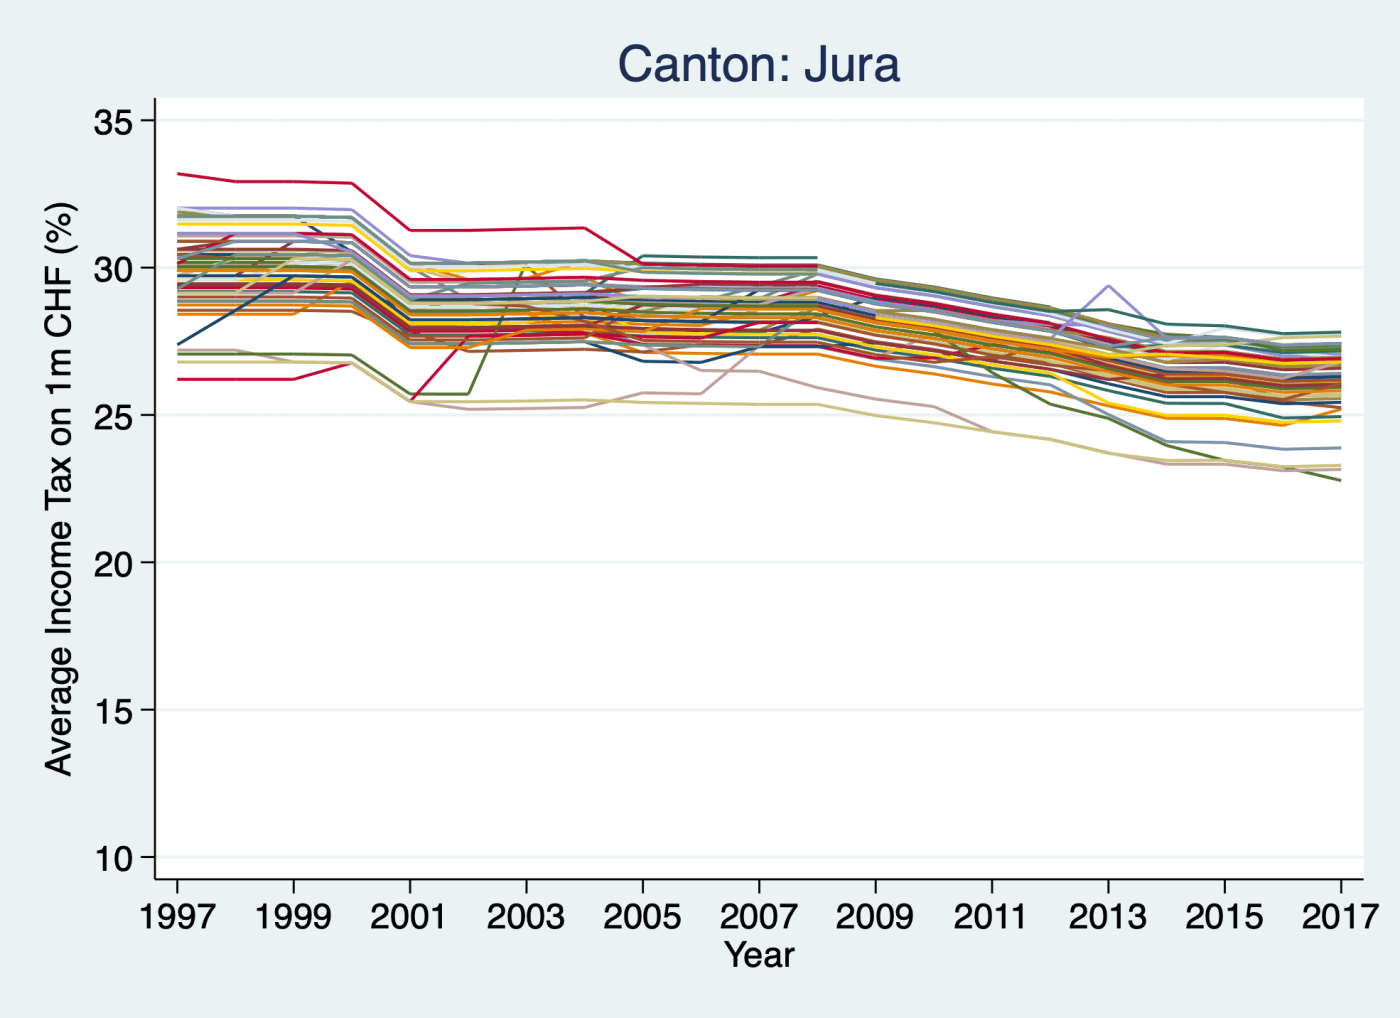
The following line graphs show tax rates on 1m CHF in income of all Swiss municipalities over time (1997–2017). Calculated as the average of the tax paid in percent by 3 hypothetical households each earning 1m CHF per year: a single person, a couple, and a couple with 2 children. In no particular order.
Something weird is going on in the graphs of Neuchâtel, Valais and Glarus. Glarus combined its many municipalities to just 3 in 2010, leading to a clean break in the series to 2011. Valais uses a different mechanism for calculating the tax rate at the municipal level to all the other cantons, which leads its 122 municipalities to have tax rates that move in similar bands. The cross-bars are created when a municipality changes its tax rate. The peculiarities of the Neuchâtel graph are a mystery to me.
Source: Replication package of Brülhart, Marius, Jonathan Gruber, Matthias Krapf, and Kurt Schmidheiny. 2022. “Behavioral Responses to Wealth Taxes: Evidence from Switzerland.” American Economic Journal: Economic Policy, 14 (4): 111–50. https://doi.org/10.1257/pol.20200258